<< Chapter < Page Chapter >> Page >

By the end of this section, you will be able to:

  • Explain recessions, depressions, peaks, and troughs
  • Evaluate the importance of tracking real GDP over time
  • Analyze the impact of economic fluctuations on a country’s output and price level

When news reports indicate that “the economy grew 1.2% in the first quarter,” the reports are referring to the percentage change in real GDP. By convention, GDP growth is reported at an annualized rate: Whatever the calculated growth in real GDP was for the quarter, it is multiplied by four when it is reported as if the economy were growing at that rate for a full year.

U.s. gdp, 1900–2014

The graph illustrates that both real GDP and real GDP per capita have substantially increased since 1900.
Real GDP in the United States in 2014 was about $16 trillion. After adjusting to remove the effects of inflation, this represents a roughly 20-fold increase in the economy’s production of goods and services since the start of the twentieth century. (Source: bea.gov)

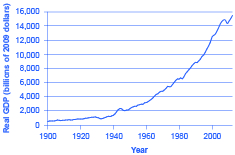
[link] shows the pattern of U.S. real GDP since 1900. The generally upward long-term path of GDP has been regularly interrupted by short-term declines. A significant decline in real GDP is called a recession    . An especially lengthy and deep recession is called a depression    . The severe drop in GDP that occurred during the Great Depression of the 1930s is clearly visible in the figure, as is the Great Recession of 2008–2009.

Real GDP is important because it is highly correlated with other measures of economic activity, like employment and unemployment. When real GDP rises, so does employment.

The most significant human problem associated with recessions (and their larger, uglier cousins, depressions) is that a slowdown in production means that firms need to lay off or fire some of the workers they have. Losing a job imposes painful financial and personal costs on workers, and often on their extended families as well. In addition, even those who keep their jobs are likely to find that wage raises are scanty at best—or they may even be asked to take pay cuts.

[link] lists the pattern of recessions and expansions in the U.S. economy since 1900. The highest point of the economy, before the recession begins, is called the peak    ; conversely, the lowest point of a recession, before a recovery begins, is called the trough    . Thus, a recession lasts from peak to trough, and an economic upswing runs from trough to peak. The movement of the economy from peak to trough and trough to peak is called the business cycle    . It is intriguing to notice that the three longest trough-to-peak expansions of the twentieth century have happened since 1960. The most recent recession started in December 2007 and ended formally in June 2009. This was the most severe recession since the Great Depression of the 1930’s.

(Source: http://www.nber.org/cycles/main.html)
U.s. business cycles since 1900
Trough Peak Months of Contraction Months of Expansion
December 1900 September 1902 18 21
August 1904 May 1907 23 33
June 1908 January 1910 13 19
January 1912 January 1913 24 12
December 1914 August 1918 23 44
March 1919 January 1920 7 10
July 1921 May 1923 18 22
July 1924 October 1926 14 27
November 1927 August 1929 23 21
March 1933 May 1937 43 50
June 1938 February 1945 13 80
October 1945 November 1948 8 37
October 1949 July 1953 11 45
May 1954 August 1957 10 39
April 1958 April 1960 8 24
February 1961 December 1969 10 106
November 1970 November 1973 11 36
March 1975 January 1980 16 58
July 1980 July 1981 6 12
November 1982 July 1990 16 92
March 2001 November 2001 8 120
December 2007 June 2009 18 73

A private think tank, the National Bureau of Economic Research (NBER) , is the official tracker of business cycles for the U.S. economy. However, the effects of a severe recession often linger on after the official ending date assigned by the NBER.

Key concepts and summary

Over the long term, U.S. real GDP have increased dramatically. At the same time, GDP has not increased the same amount each year. The speeding up and slowing down of GDP growth represents the business cycle. When GDP declines significantly, a recession occurs. A longer and deeper decline is a depression. Recessions begin at the peak of the business cycle and end at the trough.

References

The National Bureau of Economic Research. “Information on Recessions and Recoveries, the NBER Business Cycle Dating Committee, and related topics.” http://www.nber.org/cycles/main.html.

Questions & Answers

it is the relatively stable flow of income
Chidubem Reply
what is circular flow of income
Divine Reply
branches of macroeconomics
SHEDRACK Reply
what is Flexible exchang rate?
poudel Reply
is gdp a reliable measurement of wealth
Atega Reply
introduction to econometrics
Husseini Reply
Hi
mostafa
hi
LEMLEM
hello
Sammol
hi
Mahesh
bi
Ruqayat
hi
Ruqayat
Hi fellas
Nyawa
hey
Sammol
hi
God
hello
Jahara
Good morning
Jorge
hi
abubakar
hi
Nmesoma
hi
Mahesh
Hi
Tom
Why is unemployment rate never zero at full employment?
Priyanka Reply
bcoz of existence of frictional unemployment in our economy.
Umashankar
what is flexible exchang rate?
poudel
due to existence of the pple with disabilities
Abdulraufu
the demand of a good rises, causing the demand for another good to fall
Rushawn Reply
is it possible to leave every good at the same level
Joseph
I don't think so. because check it, if the demand for chicken increases, people will no longer consume fish like they used to causing a fall in the demand for fish
Anuolu
is not really possible to let the value of a goods to be same at the same time.....
Salome
Suppose the inflation rate is 6%, does it mean that all the goods you purchase will cost 6% more than previous year? Provide with reasoning.
Geetha Reply
Not necessarily. To measure the inflation rate economists normally use an averaged price index of a basket of certain goods. So if you purchase goods included in the basket, you will notice that you pay 6% more, otherwise not necessarily.
Waeth
discus major problems of macroeconomics
Alii Reply
what is the problem of macroeconomics
Yoal
Economic growth Stable prices and low unemployment
Ephraim
explain inflationcause and itis degre
Miresa Reply
what is inflation
Getu
increase in general price levels
WEETO
Good day How do I calculate this question: C= 100+5yd G= 2000 T= 2000 I(planned)=200. Suppose the actual output is 3000. What is the level of planned expenditures at this level of output?
Chisomo Reply
how to calculate actual output?
Chisomo
how to calculate the equilibrium income
Beshir
Criteria for determining money supply
Thapase Reply
who we can define macroeconomics in one line
Muhammad
Aggregate demand
Mohammed
C=k100 +9y and i=k50.calculate the equilibrium level of output
Mercy Reply
Hi
Isiaka
Hi
Geli
hy
Man
👋
Bahunda
hy how are you?
Man
ys
Amisha
how are you guys
Sekou
f9 guys
Amisha
how are you guys
Sekou
ys am also fine
Amisha
fine and you guys
Geli
from Nepal
Amisha
nawalparasi district from belatari
Amisha
nd u
Amisha
I am Camara from Guinea west Africa... happy to meet you guys here
Sekou
ma management ho
Amisha
ahile becheclor ho
Amisha
hjr ktm bta ho ani k kaam grnu hunxa tw
Amisha
belatari
Amisha
1st year ho
Amisha
nd u
Amisha
ahh
Amisha
kaha biratnagar
Amisha
ys
Amisha
kina k vo
Amisha
money as unit of account means what?
Kalombe
A unit of account is something that can be used to value goods and services and make calculations
Jim
all of you please speak in English I can't understand you're language
Muhammad
I want to know how can we define macroeconomics in one line
Muhammad
it must be .9 or 0.9 no Mpc is greater than 1 Y=100+.9Y+50 Y-.9Y=150 0.1Y/0.1=150/0.1 Y=1500
Kalombe
Mercy is it clear?😋
Kalombe
hi can someone help me on this question If a negative shocks shifts the IS curve to the left, what type of policy do you suggest so as to stabilize the level of output? discuss your answer using appropriate graph.
Galge Reply
if interest rate is increased this will will reduce the level of income shifting the curve to the left ◀️
Kalombe
Got questions? Join the online conversation and get instant answers!
Jobilize.com Reply

Get Jobilize Job Search Mobile App in your pocket Now!

Get it on Google Play Download on the App Store Now


Source:  OpenStax, Principles of economics. OpenStax CNX. Sep 19, 2014 Download for free at http://legacy.cnx.org/content/col11613/1.11
Google Play and the Google Play logo are trademarks of Google Inc.

Notification Switch

Would you like to follow the 'Principles of economics' conversation and receive update notifications?

Ask