<< Chapter < Page Chapter >> Page >

Unexpected productivity changes and unemployment

The two graphs reveal how changes in productivity can impact wages and unemployment
(a) Productivity is rising, increasing the demand for labor. Employers and workers become used to the pattern of wage increases. Then productivity suddenly stops increasing. However, the expectations of employers and workers for wage increases do not shift immediately, so wages keep rising as before. But the demand for labor has not increased, so at wage W 4 , unemployment exists where the quantity supplied of labor exceeds the quantity demanded. (b) The rate of productivity increase has been zero for a time, so employers and workers have come to accept the equilibrium wage level (W). Then productivity increases unexpectedly, shifting demand for labor from D 0 to D 1 . At the wage (W), this means that the quantity demanded of labor exceeds the quantity supplied, and with job offers plentiful, the unemployment rate will be low.

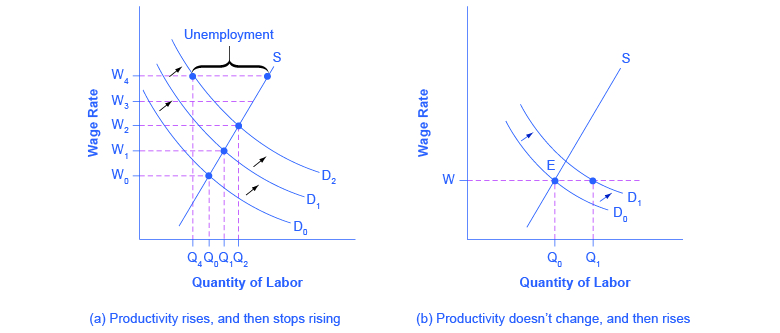
The late 1990s provide an opposite example: instead of the surprise decline in productivity in the 1970s, productivity unexpectedly rose in the mid-1990s. The annual growth rate of real output per hour of labor increased from 1.7% from 1980–1995, to an annual rate of 2.6% from 1995–2001. Let’s simplify the situation a bit, so that the economic lesson of the story is easier to see graphically, and say that productivity had not been increasing at all in earlier years, so the intersection of the labor market was at point E in [link] (b), where the demand curve for labor (D 0 ) intersects the supply curve for labor. As a result, real wages were not increasing. Now, productivity jumps upward, which shifts the demand for labor out to the right, from D 0 to D 1 . At least for a time, however, wages are still being set according to the earlier expectations of no productivity growth, so wages do not rise. The result is that at the prevailing wage level (W), the quantity of labor demanded (Qd) will for a time exceed the quantity of labor supplied (Qs), and unemployment will be very low—actually below the natural level of unemployment for a time. This pattern of unexpectedly high productivity helps to explain why the unemployment rate stayed below 4.5%—quite a low level by historical standards—from 1998 until after the U.S. economy had entered a recession in 2001.

Average levels of unemployment will tend to be somewhat higher on average when productivity is unexpectedly low, and conversely, will tend to be somewhat lower on average when productivity is unexpectedly high. But over time, wages do eventually adjust to reflect productivity levels.

Public policy and the natural rate of unemployment

Public policy can also have a powerful effect on the natural rate of unemployment. On the supply side of the labor market, public policies to assist the unemployed can affect how eager people are to find work. For example, if a worker who loses a job is guaranteed a generous package of unemployment insurance, welfare benefits, food stamps, and government medical benefits, then the opportunity cost of being unemployed is lower and that worker will be less eager to seek a new job.

Questions & Answers

Ayele, K., 2003. Introductory Economics, 3rd ed., Addis Ababa.
Widad Reply
can you send the book attached ?
Ariel
?
Ariel
What is economics
Widad Reply
the study of how humans make choices under conditions of scarcity
AI-Robot
U(x,y) = (x×y)1/2 find mu of x for y
Desalegn Reply
U(x,y) = (x×y)1/2 find mu of x for y
Desalegn
what is ecnomics
Jan Reply
this is the study of how the society manages it's scarce resources
Belonwu
what is macroeconomic
John Reply
macroeconomic is the branch of economics which studies actions, scale, activities and behaviour of the aggregate economy as a whole.
husaini
etc
husaini
difference between firm and industry
husaini Reply
what's the difference between a firm and an industry
Abdul
firm is the unit which transform inputs to output where as industry contain combination of firms with similar production 😅😅
Abdulraufu
Suppose the demand function that a firm faces shifted from Qd  120 3P to Qd  90  3P and the supply function has shifted from QS  20  2P to QS 10  2P . a) Find the effect of this change on price and quantity. b) Which of the changes in demand and supply is higher?
Toofiq Reply
explain standard reason why economic is a science
innocent Reply
factors influencing supply
Petrus Reply
what is economic.
Milan Reply
scares means__________________ends resources. unlimited
Jan
economics is a science that studies human behaviour as a relationship b/w ends and scares means which have alternative uses
Jan
calculate the profit maximizing for demand and supply
Zarshad Reply
Why qualify 28 supplies
Milan
what are explicit costs
Nomsa Reply
out-of-pocket costs for a firm, for example, payments for wages and salaries, rent, or materials
AI-Robot
concepts of supply in microeconomics
David Reply
economic overview notes
Amahle Reply
identify a demand and a supply curve
Salome Reply
i don't know
Parul
there's a difference
Aryan
Demand curve shows that how supply and others conditions affect on demand of a particular thing and what percent demand increase whith increase of supply of goods
Israr
Hi Sir please how do u calculate Cross elastic demand and income elastic demand?
Abari
Got questions? Join the online conversation and get instant answers!
Jobilize.com Reply

Get Jobilize Job Search Mobile App in your pocket Now!

Get it on Google Play Download on the App Store Now


Source:  OpenStax, Principles of economics. OpenStax CNX. Sep 19, 2014 Download for free at http://legacy.cnx.org/content/col11613/1.11
Google Play and the Google Play logo are trademarks of Google Inc.

Notification Switch

Would you like to follow the 'Principles of economics' conversation and receive update notifications?

Ask