<< Chapter < Page Chapter >> Page >

Inflation around the world

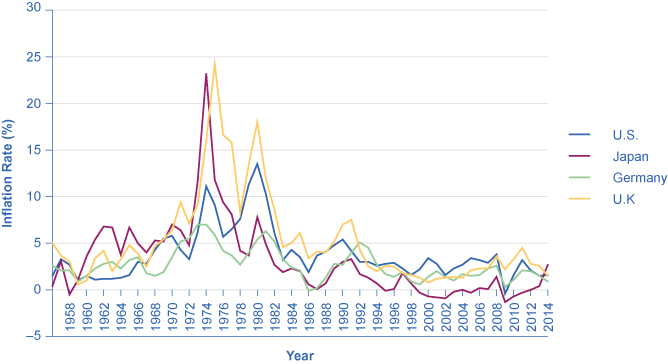
Around the rest of the world, the pattern of inflation has been very mixed, as can be seen in [link] which shows inflation rates over the last several decades. Many industrialized countries, not just the United States, had relatively high inflation rates in the 1970s. For example, in 1975, Japan’s inflation rate was over 8% and the inflation rate for the United Kingdom was almost 25%. In the 1980s, inflation rates came down in the United States and in Europe and have largely stayed down.

Countries with relatively low inflation rates, 1960–2014

The graph shows that the United States, Japan, Germany, and the United Kingdom all had periods of high inflation in the 1970s and early 1980s, though Germany did not have nearly the high rates of inflation as seen in the other countries. Since the early 1990s, all four countries have had inflation rates below 5%, with Japan’s rate consistently lower than those of Germany, the United Kingdom, and the United States. However, the graph also shows that, as of 2014, Japan had the highest inflation rate of the four.
This chart shows the annual percentage change in consumer prices compared with the previous year’s consumer prices in the United States, the United Kingdom, Japan, and Germany.

Countries with controlled economies in the 1970s, like the Soviet Union and China, historically had very low rates of measured inflation—because prices were forbidden to rise by law, except for the cases where the government deemed a price increase to be due to quality improvements. However, these countries also had perpetual shortages of goods, since forbidding prices to rise acts like a price ceiling and creates a situation where quantity demanded often exceeds quantity supplied. As Russia and China made a transition toward more market-oriented economies, they also experienced outbursts of inflation, although the statistics for these economies should be regarded as somewhat shakier. Inflation in China averaged about 10% per year for much of the 1980s and early 1990s, although it has dropped off since then. Russia experienced hyperinflation    —an outburst of high inflation—of 2,500% per year in the early 1990s, although by 2006 Russia’s consumer price inflation had dipped below 10% per year, as shown in [link] . The closest the United States has ever gotten to hyperinflation was during the Civil War, 1860–1865, in the Confederate states.

Countries with relatively high inflation rates, 1980–2013

The first graph shows that Brazil had an extremely high inflation rate, over 2000%, in 1990. The second graph, which is on a smaller scale, shows that Russia had a spike in its inflation rate in the late 1990s. Though Russia's rates have all been lower over the last decade, they are still relatively high rates.
These charts show the percentage change in consumer prices compared with the previous year’s consumer prices in Brazil, China, and Russia. (a) Of these, Brazil and Russia experienced hyperinflation at some point between the mid-1980s and mid-1990s. (b) Though not as high, China and Nigeria also had high inflation rates in the mid-1990s. Even though their inflation rates have come down over the last two decades, several of these countries continue to see significant inflation rates. (Sources: http://research.stlouisfed.org/fred2/series/FPCPITOTLZGBRA; http://research.stlouisfed.org/fred2/series/CHNCPIALLMINMEI; http://research.stlouisfed.org/fred2/series/FPCPITOTLZGRUS)

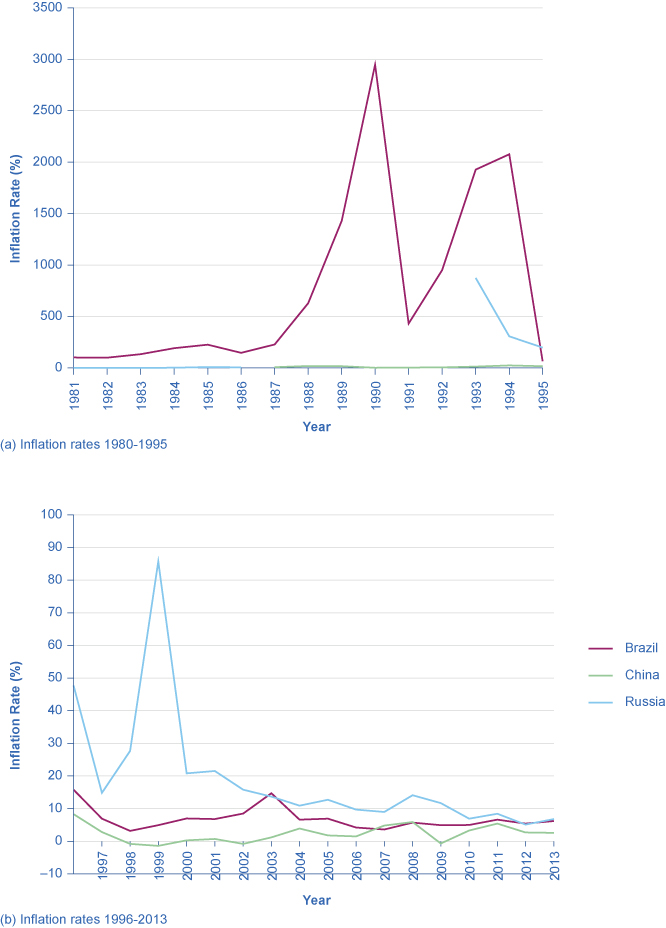
Many countries in Latin America experienced raging hyperinflation during the 1980s and early 1990s, with inflation rates often well above 100% per year. In 1990, for example, both Brazil and Argentina saw inflation climb above 2000%. Certain countries in Africa experienced extremely high rates of inflation, sometimes bordering on hyperinflation, in the 1990s. Nigeria, the most populous country in Africa, had an inflation rate of 75% in 1995.

In the early 2000s, the problem of inflation appears to have diminished for most countries, at least in comparison to the worst times of recent decades. As we noted in this earlier Bring it Home feature, in recent years, the world’s worst example of hyperinflation was in Zimbabwe, where at one point the government was issuing bills with a face value of $100 trillion (in Zimbabwean dollars)—that is, the bills had $100,000,000,000,000 written on the front, but were almost worthless. In many countries, the memory of double-digit, triple-digit, and even quadruple-digit inflation is not very far in the past.

Key concepts and summary

In the U.S. economy, the annual inflation rate in the last two decades has typically been around 2% to 4%. The periods of highest inflation in the United States in the twentieth century occurred during the years after World Wars I and II, and in the 1970s. The period of lowest inflation—actually, with deflation—was the Great Depression of the 1930s.

Problems

Within 1 or 2 percentage points, what has the U.S. inflation rate been during the last 20 years? Draw a graph to show the data.

Got questions? Get instant answers now!

Questions & Answers

how to study physic and understand
Ewa Reply
what is conservative force with examples
Moses
what is work
Fredrick Reply
the transfer of energy by a force that causes an object to be displaced; the product of the component of the force in the direction of the displacement and the magnitude of the displacement
AI-Robot
why is it from light to gravity
Esther Reply
difference between model and theory
Esther
Is the ship moving at a constant velocity?
Kamogelo Reply
The full note of modern physics
aluet Reply
introduction to applications of nuclear physics
aluet Reply
the explanation is not in full details
Moses Reply
I need more explanation or all about kinematics
Moses
yes
zephaniah
I need more explanation or all about nuclear physics
aluet
Show that the equal masses particles emarge from collision at right angle by making explicit used of fact that momentum is a vector quantity
Muhammad Reply
yh
Isaac
A wave is described by the function D(x,t)=(1.6cm) sin[(1.2cm^-1(x+6.8cm/st] what are:a.Amplitude b. wavelength c. wave number d. frequency e. period f. velocity of speed.
Majok Reply
what is frontier of physics
Somto Reply
A body is projected upward at an angle 45° 18minutes with the horizontal with an initial speed of 40km per second. In hoe many seconds will the body reach the ground then how far from the point of projection will it strike. At what angle will the horizontal will strike
Gufraan Reply
Suppose hydrogen and oxygen are diffusing through air. A small amount of each is released simultaneously. How much time passes before the hydrogen is 1.00 s ahead of the oxygen? Such differences in arrival times are used as an analytical tool in gas chromatography.
Ezekiel Reply
please explain
Samuel
what's the definition of physics
Mobolaji Reply
what is physics
Nangun Reply
the science concerned with describing the interactions of energy, matter, space, and time; it is especially interested in what fundamental mechanisms underlie every phenomenon
AI-Robot
what is isotopes
Nangun Reply
nuclei having the same Z and different N s
AI-Robot
Got questions? Join the online conversation and get instant answers!
Jobilize.com Reply

Get Jobilize Job Search Mobile App in your pocket Now!

Get it on Google Play Download on the App Store Now


Source:  OpenStax, Principles of economics. OpenStax CNX. Sep 19, 2014 Download for free at http://legacy.cnx.org/content/col11613/1.11
Google Play and the Google Play logo are trademarks of Google Inc.

Notification Switch

Would you like to follow the 'Principles of economics' conversation and receive update notifications?

Ask