| << Chapter < Page | Chapter >> Page > |

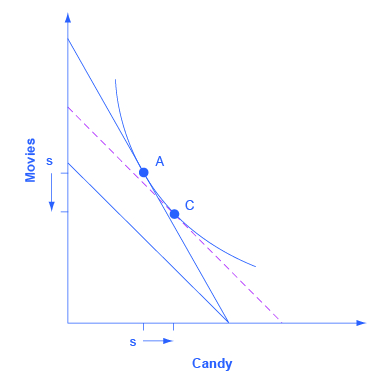
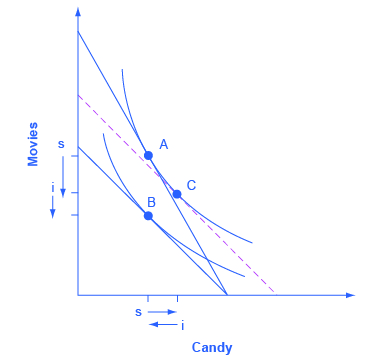
Step 5. With the substitution effect in place, now choose utility-maximizing point B on the new opportunity set. When you choose point B, think about whether you wish the substitution or the income effect to have a larger impact on the good (in this case, candy) on the horizontal axis. If you choose point B to be directly in a vertical line with point A (as is illustrated here), then the income effect will be exactly offsetting the substitution effect on the horizontal axis. If you insert point B so that it lies a little to right of the original point A, then the substitution effect will exceed the income effect. If you insert point B so that it lies a little to the left of point A, then the income effect will exceed the substitution effect. The income effect is the movement from C to B, showing how choices shifted as a result of the decline in buying power and the movement between two levels of utility, with relative prices remaining the same. With normal goods, the negative income effect means less consumed of each good, as shown by the direction of the “i” (income effect) arrows on the vertical and horizontal axes. See [link] .

In sketching substitution and income effect diagrams, you may wish to practice some of the following variations: (1) Price falls instead of a rising; (2) The price change affects the good on either the vertical or the horizontal axis; (3) Sketch these diagrams so that the substitution effect exceeds the income effect; the income effect exceeds the substitution effect; and the two effects are equal.
One final note: The helpful dashed line can be drawn tangent to the new indifference curve, and parallel to the original budget line, rather than tangent to the original indifference curve and parallel to the new budget line. Some students find this approach more intuitively clear. The answers you get about the direction and relative sizes of the substitution and income effects, however, should be the same.
An indifference curve is drawn on a budget constraint diagram that shows the tradeoffs between two goods. All points along a single indifference curve provide the same level of utility. Higher indifference curves represent higher levels of utility. Indifference curves slope downward because, if utility is to remain the same at all points along the curve, a reduction in the quantity of the good on the vertical axis must be counterbalanced by an increase in the quantity of the good on the horizontal axis (or vice versa). Indifference curves are steeper on the far left and flatter on the far right, because of diminishing marginal utility.
The utility-maximizing choice along a budget constraint will be the point of tangency where the budget constraint touches an indifference curve at a single point. A change in the price of any good has two effects: a substitution effect and an income effect. The substitution effect motivation encourages a utility-maximizer to buy less of what is relatively more expensive and more of what is relatively cheaper. The income effect motivation encourages a utility-maximizer to buy more of both goods if utility rises or less of both goods if utility falls (if they are both normal goods).
In a labor-leisure choice, every wage change has a substitution and an income effect. The substitution effect of a wage increase is to choose more income, since it is cheaper to earn, and less leisure, since its opportunity cost has increased. The income effect of a wage increase is to choose more of leisure and income, since they are both normal goods. The substitution and income effects of a wage decrease would reverse these directions.
In an intertemporal consumption choice, every interest rate change has a substitution and an income effect. The substitution effect of an interest rate increase is to choose more future consumption, since it is now cheaper to earn future consumption and less present consumption (more savings), since the opportunity cost of present consumption in terms of what is being given up in the future has increased. The income effect of an interest rate increase is to choose more of both present and future consumption, since they are both normal goods. The substitution and income effects of an interest rate decrease would reverse these directions.
What point is preferred along an indifference curve?
Why do indifference curves slope down?
Why are indifference curves steep on the left and flatter on the right?
How many indifference curves does a person have?
How can you tell which indifference curves represent higher or lower levels of utility?
What is a substitution effect?
What is an income effect?
Does the “income effect” involve a change in income? Explain.
Does a change in price have both an income effect and a substitution effect? Does a change in income have both an income effect and a substitution effect?
Would you expect, in some cases, to see only an income effect or only a substitution effect? Explain.
Which is larger, the income effect or the substitution effect?

Notification Switch
Would you like to follow the 'Principles of economics' conversation and receive update notifications?