

| << Chapter < Page | Chapter >> Page > |
A supply curve shows how quantity supplied will change as the price rises and falls, assuming ceteris paribus so that no other economically relevant factors are changing. If other factors relevant to supply do change, then the entire supply curve will shift. Just as a shift in demand is represented by a change in the quantity demanded at every price, a shift in supply means a change in the quantity supplied at every price.
In thinking about the factors that affect supply, remember what motivates firms: profits, which are the difference between revenues and costs. Goods and services are produced using combinations of labor, materials, and machinery, or what we call inputs or factors of production . If a firm faces lower costs of production, while the prices for the good or service the firm produces remain unchanged, a firm’s profits go up. When a firm’s profits increase, it is more motivated to produce output, since the more it produces the more profit it will earn. So, when costs of production fall, a firm will tend to supply a larger quantity at any given price for its output. This can be shown by the supply curve shifting to the right.
Take, for example, a messenger company that delivers packages around a city. The company may find that buying gasoline is one of its main costs. If the price of gasoline falls, then the company will find it can deliver messages more cheaply than before. Since lower costs correspond to higher profits, the messenger company may now supply more of its services at any given price. For example, given the lower gasoline prices, the company can now serve a greater area, and increase its supply.
Conversely, if a firm faces higher costs of production, then it will earn lower profits at any given selling price for its products. As a result, a higher cost of production typically causes a firm to supply a smaller quantity at any given price. In this case, the supply curve shifts to the left.
Consider the supply for cars, shown by curve S 0 in [link] . Point J indicates that if the price is $20,000, the quantity supplied will be 18 million cars. If the price rises to $22,000 per car, ceteris paribus, the quantity supplied will rise to 20 million cars, as point K on the S 0 curve shows. The same information can be shown in table form, as in [link] .
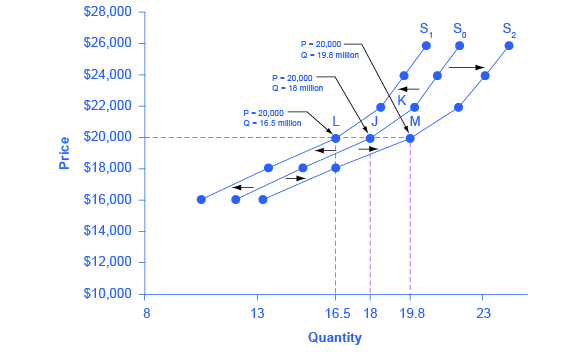
| Price | Decrease to S 1 | Original Quantity Supplied S 0 | Increase to S 2 |
|---|---|---|---|
| $16,000 | 10.5 million | 12.0 million | 13.2 million |
| $18,000 | 13.5 million | 15.0 million | 16.5 million |
| $20,000 | 16.5 million | 18.0 million | 19.8 million |
| $22,000 | 18.5 million | 20.0 million | 22.0 million |
| $24,000 | 19.5 million | 21.0 million | 23.1 million |
| $26,000 | 20.5 million | 22.0 million | 24.2 million |
Now, imagine that the price of steel, an important ingredient in manufacturing cars, rises, so that producing a car has become more expensive. At any given price for selling cars, car manufacturers will react by supplying a lower quantity. This can be shown graphically as a leftward shift of supply, from S 0 to S 1 , which indicates that at any given price, the quantity supplied decreases. In this example, at a price of $20,000, the quantity supplied decreases from 18 million on the original supply curve (S 0 ) to 16.5 million on the supply curve S 1 , which is labeled as point L.
Notification Switch
Would you like to follow the 'Principles of economics' conversation and receive update notifications?

|
|
|
|
|

|
|

|
|
|
|
|

|
|

|
|

|
|

|
|

|
|

|
|

|