<< Chapter < Page Chapter >> Page >

Visit this website to read FAQs on the BEA site. You can even email your own questions!

When thinking about the demand for domestically produced goods in a global economy, it is important to count spending on exports—domestically produced goods that are sold abroad. By the same token, we must also subtract spending on imports—goods produced in other countries that are purchased by residents of this country. The net export component of GDP is equal to the dollar value of exports (X) minus the dollar value of imports (M), (X – M). The gap between exports and imports is called the trade balance    . If a country’s exports are larger than its imports, then a country is said to have a trade surplus    . In the United States, exports typically exceeded imports in the 1960s and 1970s, as shown in [link] (b).

Since the early 1980s, imports have typically exceeded exports, and so the United States has experienced a trade deficit    in most years. Indeed, the trade deficit grew quite large in the late 1990s and in the mid-2000s. [link] (b) also shows that imports and exports have both risen substantially in recent decades, even after the declines during the Great Recession between 2008 and 2009. As noted before, if exports and imports are equal, foreign trade has no effect on total GDP. However, even if exports and imports are balanced overall, foreign trade might still have powerful effects on particular industries and workers by causing nations to shift workers and physical capital investment toward one industry rather than another.

Based on these four components of demand, GDP can be measured as:

GDP  =  Consumption + Investment + Government + Trade balance GDP  =  C + I + G + (X – M)

Understanding how to measure GDP is important for analyzing connections in the macro economy and for thinking about macroeconomic policy tools.

Gdp measured by what is produced

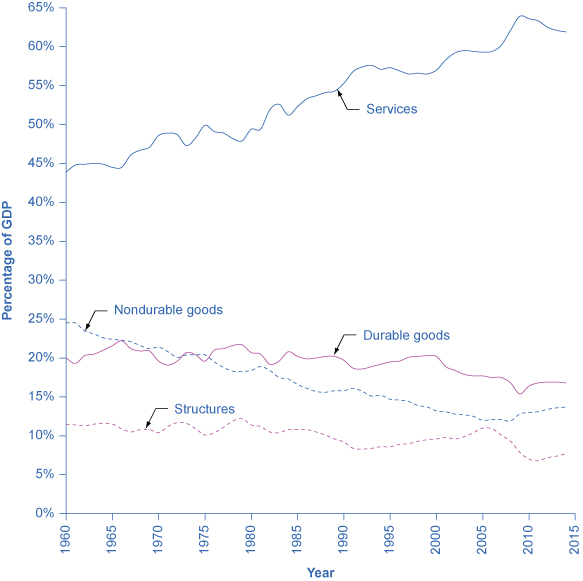
Everything that is purchased must be produced first. [link] breaks down what is produced into five categories: durable goods , nondurable goods , services , structures , and the change in inventories . Before going into detail about these categories, notice that total GDP measured according to what is produced is exactly the same as the GDP measured by looking at the five components of demand. [link] provides a visual representation of this information.

(Source: http://bea.gov/iTable/index_nipa.cfm)
Components of u.s. gdp on the production side, 2014
Components of GDP on the Supply Side (in trillions of dollars) Percentage of Total
Goods
Durable goods $2.9 16.7%
Nondurable goods $2.3 13.2%
Services $10.8 62.1%
Structures $1.3 7.4%
Change in inventories $0.1 0.6%
Total GDP $17.4 100%

Percentage of components of gdp on the production side

The pie chart shows that services take up almost half of the chart, followed by durable goods, nondurable goods, structures, and change in inventories.
Services make up over half of the production side components of GDP in the United States.

Since every market transaction must have both a buyer and a seller, GDP must be the same whether measured by what is demanded or by what is produced. [link] shows these components of what is produced, expressed as a percentage of GDP, since 1960.

Types of production

The graph shows that since 1960, structures have mostly remained around 10%, but dipped to 7.7% in 2014, and durable goods have mostly remained around 20%, but dipped in 2014 to 16.8%. The graph also shows that services have steadily increased from less than 30% in 1960 to over 61.9%  in 2014. In contrast, nondurable goods have steadily decreased from roughly 40% in 1960 to around 13.7% in 2014.
Services are the largest single component of total supply, representing over half of GDP. Nondurable goods used to be larger than durable goods, but in recent years, nondurable goods have been dropping closer to durable goods, which is about 20% of GDP. Structures hover around 10% of GDP. The change in inventories, the final component of aggregate supply, is not shown here; it is typically less than 1% of GDP.

Questions & Answers

how do you get the 2/50
Abba Reply
number of sport play by 50 student construct discrete data
Aminu Reply
width of the frangebany leaves on how to write a introduction
Theresa Reply
Solve the mean of variance
Veronica Reply
Step 1: Find the mean. To find the mean, add up all the scores, then divide them by the number of scores. ... Step 2: Find each score's deviation from the mean. ... Step 3: Square each deviation from the mean. ... Step 4: Find the sum of squares. ... Step 5: Divide the sum of squares by n – 1 or N.
kenneth
what is error
Yakuba Reply
Is mistake done to something
Vutshila
Hy
anas
hy
What is the life teble
anas
hy
Jibrin
statistics is the analyzing of data
Tajudeen Reply
what is statics?
Zelalem Reply
how do you calculate mean
Gloria Reply
diveving the sum if all values
Shaynaynay
let A1,A2 and A3 events be independent,show that (A1)^c, (A2)^c and (A3)^c are independent?
Fisaye Reply
what is statistics
Akhisani Reply
data collected all over the world
Shaynaynay
construct a less than and more than table
Imad Reply
The sample of 16 students is taken. The average age in the sample was 22 years with astandard deviation of 6 years. Construct a 95% confidence interval for the age of the population.
Aschalew Reply
Bhartdarshan' is an internet-based travel agency wherein customer can see videos of the cities they plant to visit. The number of hits daily is a normally distributed random variable with a mean of 10,000 and a standard deviation of 2,400 a. what is the probability of getting more than 12,000 hits? b. what is the probability of getting fewer than 9,000 hits?
Akshay Reply
Bhartdarshan'is an internet-based travel agency wherein customer can see videos of the cities they plan to visit. The number of hits daily is a normally distributed random variable with a mean of 10,000 and a standard deviation of 2,400. a. What is the probability of getting more than 12,000 hits
Akshay
1
Bright
Sorry i want to learn more about this question
Bright
Someone help
Bright
a= 0.20233 b=0.3384
Sufiyan
a
Shaynaynay
How do I interpret level of significance?
Mohd Reply
It depends on your business problem or in Machine Learning you could use ROC- AUC cruve to decide the threshold value
Shivam
how skewness and kurtosis are used in statistics
Owen Reply
yes what is it
Taneeya
Got questions? Join the online conversation and get instant answers!
Jobilize.com Reply

Get Jobilize Job Search Mobile App in your pocket Now!

Get it on Google Play Download on the App Store Now


Source:  OpenStax, Principles of economics. OpenStax CNX. Sep 19, 2014 Download for free at http://legacy.cnx.org/content/col11613/1.11
Google Play and the Google Play logo are trademarks of Google Inc.

Notification Switch

Would you like to follow the 'Principles of economics' conversation and receive update notifications?

Ask