<< Chapter < Page Chapter >> Page >

[link] illustrates demand and supply in the financial market for credit cards. The horizontal axis of the financial market shows the quantity of money that is loaned or borrowed in this market. The vertical or price axis shows the rate of return, which in the case of credit card borrowing can be measured with an interest rate. [link] shows the quantity of financial capital that consumers demand at various interest rates and the quantity that credit card firms (often banks) are willing to supply.

Demand and supply for borrowing money with credit cards

The graph shows how a price set below equilibrium causes a shortage of credit and how one set above the equilibrium creates a surplus of credit
In this market for credit card borrowing, the demand curve (D) for borrowing financial capital intersects the supply curve (S) for lending financial capital at equilibrium €. At the equilibrium, the interest rate (the “price” in this market) is 15% and the quantity of financial capital being loaned and borrowed is $600 billion. The equilibrium price is where the quantity demanded and the quantity supplied are equal. At an above-equilibrium interest rate like 21%, the quantity of financial capital supplied would increase to $750 billion, but the quantity demanded would decrease to $480 billion. At a below-equilibrium interest rate like 13%, the quantity of financial capital demanded would increase to $700 billion, but the quantity of financial capital supplied would decrease to $510 billion.
Demand and supply for borrowing money with credit cards
Interest Rate (%) Quantity of Financial Capital Demanded (Borrowing) ($ billions) Quantity of Financial Capital Supplied (Lending) ($ billions)
11 $800 $420
13 $700 $510
15 $600 $600
17 $550 $660
19 $500 $720
21 $480 $750

The laws of demand and supply continue to apply in the financial markets. According to the law of demand    , a higher rate of return (that is, a higher price) will decrease the quantity demanded. As the interest rate rises, consumers will reduce the quantity that they borrow. According to the law of supply, a higher price increases the quantity supplied. Consequently, as the interest rate paid on credit card borrowing rises, more firms will be eager to issue credit cards and to encourage customers to use them. Conversely, if the interest rate on credit cards falls, the quantity of financial capital supplied in the credit card market will decrease and the quantity demanded will fall.

Equilibrium in financial markets

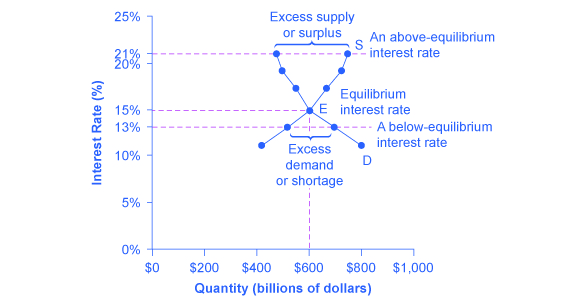
In the financial market for credit cards shown in [link] , the supply curve (S) and the demand curve (D) cross at the equilibrium point (E). The equilibrium occurs at an interest rate of 15%, where the quantity of funds demanded and the quantity supplied are equal at an equilibrium quantity of $600 billion.

If the interest rate (remember, this measures the “price” in the financial market) is above the equilibrium level, then an excess supply, or a surplus, of financial capital will arise in this market. For example, at an interest rate of 21%, the quantity of funds supplied increases to $750 billion, while the quantity demanded decreases to $480 billion. At this above-equilibrium interest rate, firms are eager to supply loans to credit card borrowers, but relatively few people or businesses wish to borrow. As a result, some credit card firms will lower the interest rates (or other fees) they charge to attract more business. This strategy will push the interest rate down toward the equilibrium level.

Questions & Answers

how do you get the 2/50
Abba Reply
number of sport play by 50 student construct discrete data
Aminu Reply
width of the frangebany leaves on how to write a introduction
Theresa Reply
Solve the mean of variance
Veronica Reply
Step 1: Find the mean. To find the mean, add up all the scores, then divide them by the number of scores. ... Step 2: Find each score's deviation from the mean. ... Step 3: Square each deviation from the mean. ... Step 4: Find the sum of squares. ... Step 5: Divide the sum of squares by n – 1 or N.
kenneth
what is error
Yakuba Reply
Is mistake done to something
Vutshila
Hy
anas
hy
What is the life teble
anas
hy
Jibrin
statistics is the analyzing of data
Tajudeen Reply
what is statics?
Zelalem Reply
how do you calculate mean
Gloria Reply
diveving the sum if all values
Shaynaynay
let A1,A2 and A3 events be independent,show that (A1)^c, (A2)^c and (A3)^c are independent?
Fisaye Reply
what is statistics
Akhisani Reply
data collected all over the world
Shaynaynay
construct a less than and more than table
Imad Reply
The sample of 16 students is taken. The average age in the sample was 22 years with astandard deviation of 6 years. Construct a 95% confidence interval for the age of the population.
Aschalew Reply
Bhartdarshan' is an internet-based travel agency wherein customer can see videos of the cities they plant to visit. The number of hits daily is a normally distributed random variable with a mean of 10,000 and a standard deviation of 2,400 a. what is the probability of getting more than 12,000 hits? b. what is the probability of getting fewer than 9,000 hits?
Akshay Reply
Bhartdarshan'is an internet-based travel agency wherein customer can see videos of the cities they plan to visit. The number of hits daily is a normally distributed random variable with a mean of 10,000 and a standard deviation of 2,400. a. What is the probability of getting more than 12,000 hits
Akshay
1
Bright
Sorry i want to learn more about this question
Bright
Someone help
Bright
a= 0.20233 b=0.3384
Sufiyan
a
Shaynaynay
How do I interpret level of significance?
Mohd Reply
It depends on your business problem or in Machine Learning you could use ROC- AUC cruve to decide the threshold value
Shivam
how skewness and kurtosis are used in statistics
Owen Reply
yes what is it
Taneeya
Got questions? Join the online conversation and get instant answers!
Jobilize.com Reply

Get Jobilize Job Search Mobile App in your pocket Now!

Get it on Google Play Download on the App Store Now


Source:  OpenStax, Principles of economics. OpenStax CNX. Sep 19, 2014 Download for free at http://legacy.cnx.org/content/col11613/1.11
Google Play and the Google Play logo are trademarks of Google Inc.

Notification Switch

Would you like to follow the 'Principles of economics' conversation and receive update notifications?

Ask