

| << Chapter < Page | Chapter >> Page > |
[link] also illustrates some peculiar traits of supply and demand diagrams in the foreign exchange market. In contrast to all the other cases of supply and demand you have considered, in the foreign exchange market , supply and demand typically both move at the same time. Groups of participants in the foreign exchange market like firms and investors include some who are buyers and some who are sellers. An expectation of a future shift in the exchange rate affects both buyers and sellers—that is, it affects both demand and supply for a currency.
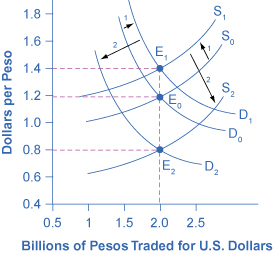
The shifts in demand and supply curves both cause the exchange rate to shift in the same direction; in this example, they both make the peso exchange rate stronger. However, the shifts in demand and supply work in opposing directions on the quantity traded. In this example, the rising demand for pesos is causing the quantity to rise while the falling supply of pesos is causing quantity to fall. In this specific example, the result is a higher quantity. But in other cases, the result could be that quantity remains unchanged or declines.
This example also helps to explain why exchange rates often move quite substantially in a short period of a few weeks or months. When investors expect a country’s currency to strengthen in the future, they buy the currency and cause it to appreciate immediately. The appreciation of the currency can lead other investors to believe that future appreciation is likely—and thus lead to even further appreciation. Similarly, a fear that a currency might weaken quickly leads to an actual weakening of the currency, which often reinforces the belief that the currency is going to weaken further. Thus, beliefs about the future path of exchange rates can be self-reinforcing, at least for a time, and a large share of the trading in foreign exchange markets involves dealers trying to outguess each other on what direction exchange rates will move next.
The motivation for investment, whether domestic or foreign, is to earn a return. If rates of return in a country look relatively high, then that country will tend to attract funds from abroad. Conversely, if rates of return in a country look relatively low, then funds will tend to flee to other economies. Changes in the expected rate of return will shift demand and supply for a currency. For example, imagine that interest rates rise in the United States as compared with Mexico. Thus, financial investments in the United States promise a higher return than they previously did. As a result, more investors will demand U.S. dollars so that they can buy interest-bearing assets and fewer investors will be willing to supply U.S. dollars to foreign exchange markets. Demand for the U.S. dollar will shift to the right, from D 0 to D 1 , and supply will shift to the left, from S 0 to S 1 , as shown in [link] . The new equilibrium (E 1 ), will occur at an exchange rate of nine pesos/dollar and the same quantity of $8.5 billion. Thus, a higher interest rate or rate of return relative to other countries leads a nation’s currency to appreciate or strengthen, and a lower interest rate relative to other countries leads a nation’s currency to depreciate or weaken. Since a nation’s central bank can use monetary policy to affect its interest rates, a central bank can also cause changes in exchange rates—a connection that will be discussed in more detail later in this chapter.
Notification Switch
Would you like to follow the 'Principles of economics' conversation and receive update notifications?

|
|
|
|
|

|
|

|
|

|
|

|
|

|
|

|
|

|
|

|
|

|
|

|