<< Chapter < Page Chapter >> Page >

By the end of this section, you will be able to:

  • Explain demand, quantity demanded, and the law of demand
  • Identify a demand curve and a supply curve
  • Explain supply, quantity supply, and the law of supply
  • Explain equilibrium, equilibrium price, and equilibrium quantity

First let’s first focus on what economists mean by demand, what they mean by supply, and then how demand and supply interact in a market.

Demand for goods and services

Economists use the term demand    to refer to the amount of some good or service consumers are willing and able to purchase at each price. Demand is based on needs and wants—a consumer may be able to differentiate between a need and a want, but from an economist’s perspective they are the same thing. Demand is also based on ability to pay. If you cannot pay for it, you have no effective demand.

What a buyer pays for a unit of the specific good or service is called price    . The total number of units purchased at that price is called the quantity demanded    . A rise in price of a good or service almost always decreases the quantity demanded of that good or service. Conversely, a fall in price will increase the quantity demanded. When the price of a gallon of gasoline goes up, for example, people look for ways to reduce their consumption by combining several errands, commuting by carpool or mass transit, or taking weekend or vacation trips closer to home. Economists call this inverse relationship between price and quantity demanded the law of demand    . The law of demand assumes that all other variables that affect demand (to be explained in the next module) are held constant.

An example from the market for gasoline can be shown in the form of a table or a graph. A table that shows the quantity demanded at each price, such as [link] , is called a demand schedule    . Price in this case is measured in dollars per gallon of gasoline. The quantity demanded is measured in millions of gallons over some time period (for example, per day or per year) and over some geographic area (like a state or a country). A demand curve    shows the relationship between price and quantity demanded on a graph like [link] , with quantity on the horizontal axis and the price per gallon on the vertical axis. (Note that this is an exception to the normal rule in mathematics that the independent variable (x) goes on the horizontal axis and the dependent variable (y) goes on the vertical. Economics is not math.)

The demand schedule shown by [link] and the demand curve shown by the graph in [link] are two ways of describing the same relationship between price and quantity demanded.
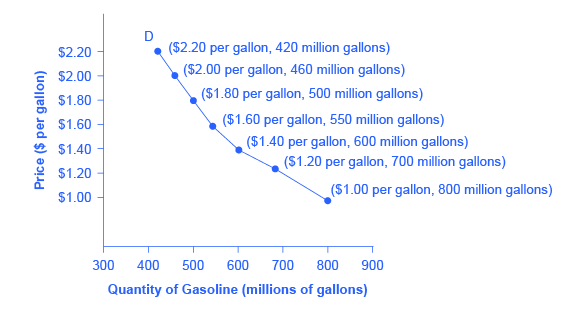
A demand curve for gasoline

The graph shows a downward-sloping demand curve that represents the law of demand.
The demand schedule shows that as price rises, quantity demanded decreases, and vice versa. These points are then graphed, and the line connecting them is the demand curve (D). The downward slope of the demand curve again illustrates the law of demand—the inverse relationship between prices and quantity demanded.
Price and quantity demanded of gasoline
Price (per gallon) Quantity Demanded (millions of gallons)
$1.00 800
$1.20 700
$1.40 600
$1.60 550
$1.80 500
$2.00 460
$2.20 420

Questions & Answers

what is biology
Hajah Reply
the study of living organisms and their interactions with one another and their environments
AI-Robot
what is biology
Victoria Reply
HOW CAN MAN ORGAN FUNCTION
Alfred Reply
the diagram of the digestive system
Assiatu Reply
allimentary cannel
Ogenrwot
How does twins formed
William Reply
They formed in two ways first when one sperm and one egg are splited by mitosis or two sperm and two eggs join together
Oluwatobi
what is genetics
Josephine Reply
Genetics is the study of heredity
Misack
how does twins formed?
Misack
What is manual
Hassan Reply
discuss biological phenomenon and provide pieces of evidence to show that it was responsible for the formation of eukaryotic organelles
Joseph Reply
what is biology
Yousuf Reply
the study of living organisms and their interactions with one another and their environment.
Wine
discuss the biological phenomenon and provide pieces of evidence to show that it was responsible for the formation of eukaryotic organelles in an essay form
Joseph Reply
what is the blood cells
Shaker Reply
list any five characteristics of the blood cells
Shaker
lack electricity and its more savely than electronic microscope because its naturally by using of light
Abdullahi Reply
advantage of electronic microscope is easily and clearly while disadvantage is dangerous because its electronic. advantage of light microscope is savely and naturally by sun while disadvantage is not easily,means its not sharp and not clear
Abdullahi
cell theory state that every organisms composed of one or more cell,cell is the basic unit of life
Abdullahi
is like gone fail us
DENG
cells is the basic structure and functions of all living things
Ramadan
What is classification
ISCONT Reply
is organisms that are similar into groups called tara
Yamosa
in what situation (s) would be the use of a scanning electron microscope be ideal and why?
Kenna Reply
A scanning electron microscope (SEM) is ideal for situations requiring high-resolution imaging of surfaces. It is commonly used in materials science, biology, and geology to examine the topography and composition of samples at a nanoscale level. SEM is particularly useful for studying fine details,
Hilary
cell is the building block of life.
Condoleezza Reply
Got questions? Join the online conversation and get instant answers!
Jobilize.com Reply

Get Jobilize Job Search Mobile App in your pocket Now!

Get it on Google Play Download on the App Store Now


Source:  OpenStax, Principles of economics. OpenStax CNX. Sep 19, 2014 Download for free at http://legacy.cnx.org/content/col11613/1.11
Google Play and the Google Play logo are trademarks of Google Inc.

Notification Switch

Would you like to follow the 'Principles of economics' conversation and receive update notifications?

Ask