<< Chapter < Page Chapter >> Page >

Average total cost, average variable cost, marginal cost

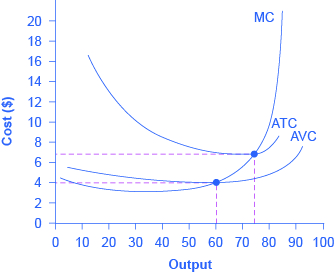
The breakdown of total costs into fixed and variable costs can provide a basis for other insights as well. The first five columns of [link] duplicate the previous table, but the last three columns show average total costs, average variable costs, and marginal costs. These new measures analyze costs on a per-unit (rather than a total) basis and are reflected in the curves shown in [link] .

Cost curves at the clip joint

The graph shows marginal cost as an upward-sloping curve, and average variable cost and average total cost as U-shaped curves.
The information on total costs, fixed cost, and variable cost can also be presented on a per-unit basis. Average total cost (ATC) is calculated by dividing total cost by the total quantity produced. The average total cost curve is typically U-shaped. Average variable cost (AVC) is calculated by dividing variable cost by the quantity produced. The average variable cost curve lies below the average total cost curve and is typically U-shaped or upward-sloping. Marginal cost (MC) is calculated by taking the change in total cost between two levels of output and dividing by the change in output. The marginal cost curve is upward-sloping.
Different types of costs
Labor Quantity Fixed Cost Variable Cost Total Cost Marginal Cost Average Total Cost Average Variable Cost
1 16 $160 $80 $240 $5.00 $15.00 $5.00
2 40 $160 $160 $320 $3.30 $8.00 $4.00
3 60 $160 $240 $400 $4.00 $6.60 $4.00
4 72 $160 $320 $480 $6.60 $6.60 $4.40
5 80 $160 $400 $560 $10.00 $7.00 $5.00
6 84 $160 $480 $640 $20.00 $7.60 $5.70

Average total cost (sometimes referred to simply as average cost) is total cost divided by the quantity of output. Since the total cost of producing 40 haircuts is $320, the average total cost for producing each of 40 haircuts is $320/40, or $8 per haircut. Average cost curves are typically U-shaped, as [link] shows. Average total cost starts off relatively high, because at low levels of output total costs are dominated by the fixed cost; mathematically, the denominator is so small that average total cost is large. Average total cost then declines, as the fixed costs are spread over an increasing quantity of output. In the average cost calculation, the rise in the numerator of total costs is relatively small compared to the rise in the denominator of quantity produced. But as output expands still further, the average cost begins to rise. At the right side of the average cost curve, total costs begin rising more rapidly as diminishing returns kick in.

Average variable cost obtained when variable cost is divided by quantity of output. For example, the variable cost of producing 80 haircuts is $400, so the average variable cost is $400/80, or $5 per haircut. Note that at any level of output, the average variable cost curve will always lie below the curve for average total cost, as shown in [link] . The reason is that average total cost includes average variable cost and average fixed cost. Thus, for Q = 80 haircuts, the average total cost is $8 per haircut, while the average variable cost is $5 per haircut. However, as output grows, fixed costs become relatively less important (since they do not rise with output), so average variable cost sneaks closer to average cost.

Questions & Answers

Ayele, K., 2003. Introductory Economics, 3rd ed., Addis Ababa.
Widad Reply
can you send the book attached ?
Ariel
?
Ariel
What is economics
Widad Reply
the study of how humans make choices under conditions of scarcity
AI-Robot
U(x,y) = (x×y)1/2 find mu of x for y
Desalegn Reply
U(x,y) = (x×y)1/2 find mu of x for y
Desalegn
what is ecnomics
Jan Reply
this is the study of how the society manages it's scarce resources
Belonwu
what is macroeconomic
John Reply
macroeconomic is the branch of economics which studies actions, scale, activities and behaviour of the aggregate economy as a whole.
husaini
etc
husaini
difference between firm and industry
husaini Reply
what's the difference between a firm and an industry
Abdul
firm is the unit which transform inputs to output where as industry contain combination of firms with similar production 😅😅
Abdulraufu
Suppose the demand function that a firm faces shifted from Qd  120 3P to Qd  90  3P and the supply function has shifted from QS  20  2P to QS 10  2P . a) Find the effect of this change on price and quantity. b) Which of the changes in demand and supply is higher?
Toofiq Reply
explain standard reason why economic is a science
innocent Reply
factors influencing supply
Petrus Reply
what is economic.
Milan Reply
scares means__________________ends resources. unlimited
Jan
economics is a science that studies human behaviour as a relationship b/w ends and scares means which have alternative uses
Jan
calculate the profit maximizing for demand and supply
Zarshad Reply
Why qualify 28 supplies
Milan
what are explicit costs
Nomsa Reply
out-of-pocket costs for a firm, for example, payments for wages and salaries, rent, or materials
AI-Robot
concepts of supply in microeconomics
David Reply
economic overview notes
Amahle Reply
identify a demand and a supply curve
Salome Reply
i don't know
Parul
there's a difference
Aryan
Demand curve shows that how supply and others conditions affect on demand of a particular thing and what percent demand increase whith increase of supply of goods
Israr
Hi Sir please how do u calculate Cross elastic demand and income elastic demand?
Abari
Got questions? Join the online conversation and get instant answers!
Jobilize.com Reply

Get Jobilize Job Search Mobile App in your pocket Now!

Get it on Google Play Download on the App Store Now


Source:  OpenStax, Principles of economics. OpenStax CNX. Sep 19, 2014 Download for free at http://legacy.cnx.org/content/col11613/1.11
Google Play and the Google Play logo are trademarks of Google Inc.

Notification Switch

Would you like to follow the 'Principles of economics' conversation and receive update notifications?

Ask