<< Chapter < Page Chapter >> Page >

Occupying wall street

This image shows hundreds of protestors during Occupy Wall Street.
On September 17, 2011, Occupy Wall Street began in New York City’s Wall Street financial district. (Credit: modification of work by David Shankbone/Flickr Creative Commons)

Occupy wall street

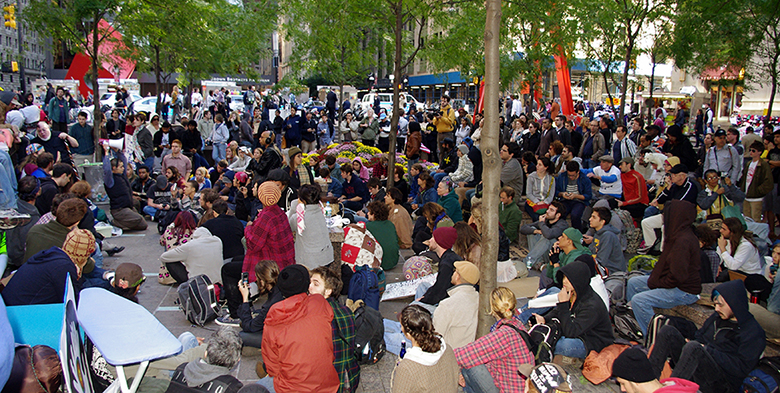
In September 2011, a group of protesters gathered in Zuccotti Park in New York City to decry what they perceived as increasing social and economic inequality in the United States. Calling their protest “Occupy Wall Street,” they argued that the concentration of wealth among the richest 1% in the United States was both economically unsustainable and inequitable, and needed to be changed. The protest then spread to other major cities, and the Occupy movement was born.

Why were people so upset? How much wealth is concentrated among the top 1% in our society? How did they acquire so much wealth? These are very real, very important questions in the United States now, and this chapter on poverty and economic inequality will help us address the causes behind this sentiment.

Introduction to poverty and economic inequality

In this chapter, you will learn about:

  • Drawing the Poverty Line
  • The Poverty Trap
  • The Safety Net
  • Income Inequality: Measurement and Causes
  • Government Policies to Reduce Income Inequality

The labor markets that determine what workers are paid do not take into account how much income a family needs for food, shelter, clothing, and health care. Market forces do not worry about what happens to families when a major local employer goes out of business. Market forces do not take time to contemplate whether those who are earning higher incomes should pay an even higher share of taxes.

However, labor markets do create considerable inequalities of income. In 2014, the median American family income was $57,939 (the median is the level where half of all families had more than that level and half had less). According to the U.S. Census Bureau, almost nine million U.S. families were classified by the federal government as being below the poverty line in that year. Think about a family of three—perhaps a single mother with two children—attempting to pay for the basics of life on perhaps $17,916 per year. After paying for rent, healthcare, clothing, and transportation, such a family might have $6,000 to spend on food. Spread over 365 days, the food budget for the entire family would be about $17 per day. To put this in perspective, most cities have restaurants where $17 will buy you an appetizer for one.

This chapter explores how the U.S. government defines poverty, the balance between assisting the poor without discouraging work, and how federal antipoverty programs work. It also discusses income inequality—how economists measure inequality, why inequality has changed in recent decades, the range of possible government policies to reduce inequality, and the danger of a tradeoff that too great a reduction in inequality may reduce incentives for producing output.

Questions & Answers

Ayele, K., 2003. Introductory Economics, 3rd ed., Addis Ababa.
Widad Reply
can you send the book attached ?
Ariel
?
Ariel
What is economics
Widad Reply
the study of how humans make choices under conditions of scarcity
AI-Robot
U(x,y) = (x×y)1/2 find mu of x for y
Desalegn Reply
U(x,y) = (x×y)1/2 find mu of x for y
Desalegn
what is ecnomics
Jan Reply
this is the study of how the society manages it's scarce resources
Belonwu
what is macroeconomic
John Reply
macroeconomic is the branch of economics which studies actions, scale, activities and behaviour of the aggregate economy as a whole.
husaini
etc
husaini
difference between firm and industry
husaini Reply
what's the difference between a firm and an industry
Abdul
firm is the unit which transform inputs to output where as industry contain combination of firms with similar production 😅😅
Abdulraufu
Suppose the demand function that a firm faces shifted from Qd  120 3P to Qd  90  3P and the supply function has shifted from QS  20  2P to QS 10  2P . a) Find the effect of this change on price and quantity. b) Which of the changes in demand and supply is higher?
Toofiq Reply
explain standard reason why economic is a science
innocent Reply
factors influencing supply
Petrus Reply
what is economic.
Milan Reply
scares means__________________ends resources. unlimited
Jan
economics is a science that studies human behaviour as a relationship b/w ends and scares means which have alternative uses
Jan
calculate the profit maximizing for demand and supply
Zarshad Reply
Why qualify 28 supplies
Milan
what are explicit costs
Nomsa Reply
out-of-pocket costs for a firm, for example, payments for wages and salaries, rent, or materials
AI-Robot
concepts of supply in microeconomics
David Reply
economic overview notes
Amahle Reply
identify a demand and a supply curve
Salome Reply
i don't know
Parul
there's a difference
Aryan
Demand curve shows that how supply and others conditions affect on demand of a particular thing and what percent demand increase whith increase of supply of goods
Israr
Hi Sir please how do u calculate Cross elastic demand and income elastic demand?
Abari
Got questions? Join the online conversation and get instant answers!
Jobilize.com Reply

Get Jobilize Job Search Mobile App in your pocket Now!

Get it on Google Play Download on the App Store Now


Source:  OpenStax, Principles of economics. OpenStax CNX. Sep 19, 2014 Download for free at http://legacy.cnx.org/content/col11613/1.11
Google Play and the Google Play logo are trademarks of Google Inc.

Notification Switch

Would you like to follow the 'Principles of economics' conversation and receive update notifications?

Ask