<< Chapter < Page Chapter >> Page >

By the end of this section, you will be able to:

  • Predict shifts in the demand and supply curves of the labor market
  • Explain the impact of new technology on the demand and supply curves of the labor market
  • Explain price floors in the labor market such as minimum wage or a living wage

Markets for labor have demand and supply curves, just like markets for goods. The law of demand applies in labor markets this way: A higher salary or wage —that is, a higher price in the labor market—leads to a decrease in the quantity of labor demanded by employers, while a lower salary or wage leads to an increase in the quantity of labor demanded. The law of supply functions in labor markets, too: A higher price for labor leads to a higher quantity of labor supplied; a lower price leads to a lower quantity supplied.

Equilibrium in the labor market

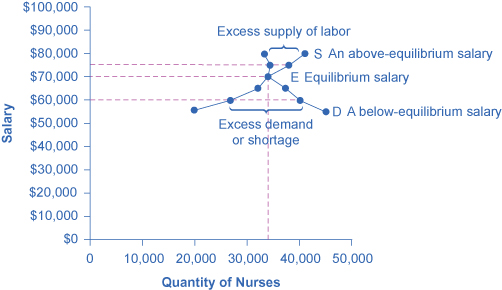
In 2013, about 34,000 registered nurses worked in the Minneapolis-St. Paul-Bloomington, Minnesota-Wisconsin metropolitan area, according to the BLS. They worked for a variety of employers: hospitals, doctors’ offices, schools, health clinics, and nursing homes. [link] illustrates how demand and supply determine equilibrium in this labor market. The demand and supply schedules in [link] list the quantity supplied and quantity demanded of nurses at different salaries.

Labor market example: demand and supply for nurses in minneapolis-st. paul-bloomington

This graph shows how equilibrium is affected by demand and supply. The downward- sloping demand curve and the upward-sloping supply curve intersect at equilibrium salary.
The demand curve (D) of those employers who want to hire nurses intersects with the supply curve (S) of those who are qualified and willing to work as nurses at the equilibrium point (E). The equilibrium salary is $70,000 and the equilibrium quantity is 34,000 nurses. At an above-equilibrium salary of $75,000, quantity supplied increases to 38,000, but the quantity of nurses demanded at the higher pay declines to 33,000. At this above-equilibrium salary, an excess supply or surplus of nurses would exist. At a below-equilibrium salary of $60,000, quantity supplied declines to 27,000, while the quantity demanded at the lower wage increases to 40,000 nurses. At this below-equilibrium salary, excess demand or a surplus exists.
Demand and supply of nurses in minneapolis-st. paul-bloomington
Annual Salary Quantity Demanded Quantity Supplied
$55,000 45,000 20,000
$60,000 40,000 27,000
$65,000 37,000 31,000
$70,000 34,000 34,000
$75,000 33,000 38,000
$80,000 32,000 41,000

The horizontal axis shows the quantity of nurses hired. In this example, labor is measured by number of workers, but another common way to measure the quantity of labor is by the number of hours worked. The vertical axis shows the price for nurses’ labor—that is, how much they are paid. In the real world, this “price” would be total labor compensation: salary plus benefits. It is not obvious, but benefits are a significant part (as high as 30 percent) of labor compensation. In this example, the price of labor is measured by salary on an annual basis, although in other cases the price of labor could be measured by monthly or weekly pay, or even the wage paid per hour. As the salary for nurses rises, the quantity demanded will fall. Some hospitals and nursing homes may cut back on the number of nurses they hire, or they may lay off some of their existing nurses, rather than pay them higher salaries. Employers who face higher nurses’ salaries may also try to replace some nursing functions by investing in physical equipment, like computer monitoring and diagnostic systems to monitor patients, or by using lower-paid health care aides to reduce the number of nurses they need.

Questions & Answers

how do you get the 2/50
Abba Reply
number of sport play by 50 student construct discrete data
Aminu Reply
width of the frangebany leaves on how to write a introduction
Theresa Reply
Solve the mean of variance
Veronica Reply
Step 1: Find the mean. To find the mean, add up all the scores, then divide them by the number of scores. ... Step 2: Find each score's deviation from the mean. ... Step 3: Square each deviation from the mean. ... Step 4: Find the sum of squares. ... Step 5: Divide the sum of squares by n – 1 or N.
kenneth
what is error
Yakuba Reply
Is mistake done to something
Vutshila
Hy
anas
hy
What is the life teble
anas
hy
Jibrin
statistics is the analyzing of data
Tajudeen Reply
what is statics?
Zelalem Reply
how do you calculate mean
Gloria Reply
diveving the sum if all values
Shaynaynay
let A1,A2 and A3 events be independent,show that (A1)^c, (A2)^c and (A3)^c are independent?
Fisaye Reply
what is statistics
Akhisani Reply
data collected all over the world
Shaynaynay
construct a less than and more than table
Imad Reply
The sample of 16 students is taken. The average age in the sample was 22 years with astandard deviation of 6 years. Construct a 95% confidence interval for the age of the population.
Aschalew Reply
Bhartdarshan' is an internet-based travel agency wherein customer can see videos of the cities they plant to visit. The number of hits daily is a normally distributed random variable with a mean of 10,000 and a standard deviation of 2,400 a. what is the probability of getting more than 12,000 hits? b. what is the probability of getting fewer than 9,000 hits?
Akshay Reply
Bhartdarshan'is an internet-based travel agency wherein customer can see videos of the cities they plan to visit. The number of hits daily is a normally distributed random variable with a mean of 10,000 and a standard deviation of 2,400. a. What is the probability of getting more than 12,000 hits
Akshay
1
Bright
Sorry i want to learn more about this question
Bright
Someone help
Bright
a= 0.20233 b=0.3384
Sufiyan
a
Shaynaynay
How do I interpret level of significance?
Mohd Reply
It depends on your business problem or in Machine Learning you could use ROC- AUC cruve to decide the threshold value
Shivam
how skewness and kurtosis are used in statistics
Owen Reply
yes what is it
Taneeya
Got questions? Join the online conversation and get instant answers!
Jobilize.com Reply

Get Jobilize Job Search Mobile App in your pocket Now!

Get it on Google Play Download on the App Store Now


Source:  OpenStax, Principles of economics. OpenStax CNX. Sep 19, 2014 Download for free at http://legacy.cnx.org/content/col11613/1.11
Google Play and the Google Play logo are trademarks of Google Inc.

Notification Switch

Would you like to follow the 'Principles of economics' conversation and receive update notifications?

Ask