<< Chapter < Page Chapter >> Page >
By the end of this section, you will be able to:
  • Analyze GDP per capita as a measure of the diversity of international standards of living
  • Identify what classifies a country as low-income, middle-income, or high-income
  • Explain how standards of living are influenced by geography, demographics, industry structure, and economic institutions

The national economies that make up the global economy are remarkably diverse. Let us use one key indicator of the standard of living, GDP per capita    , to quantify this diversity. You will quickly see that quantifying this diversity is fraught with challenges and limitations. As explained in The Macroeconomic Perspective , we must consider using purchasing power parity or “international dollars” to convert average incomes into comparable units. Purchasing power parity, as formally defined in Exchange Rates and International Capital Flows , takes into account the fact that prices of the same good are different across countries.

The Macroeconomic Perspective explained how to measure GDP, the challenges of using GDP to compare standards of living, and the difficulty of confusing economic size with distribution. In China's case, for example, China ranks as the second largest global economy, second to only the United States, with Japan being third. But, when we take China's GDP of $9.2 trillion and divide it by its population of 1.4 billion, then the per capita GDP is only $6,900, which is significantly lower than that of Japan, at $38,500, and that of the United States, at $52,800. Measurement issues aside, it’s worth repeating that the goal, then, is to not only increase GDP, but to strive toward increased GDP per capita to increase overall standards of living for individuals. As we have learned from Economic Growth , this can be achieved at the national level by designing policies that increase worker productivity, deepen capital, and advance technology.

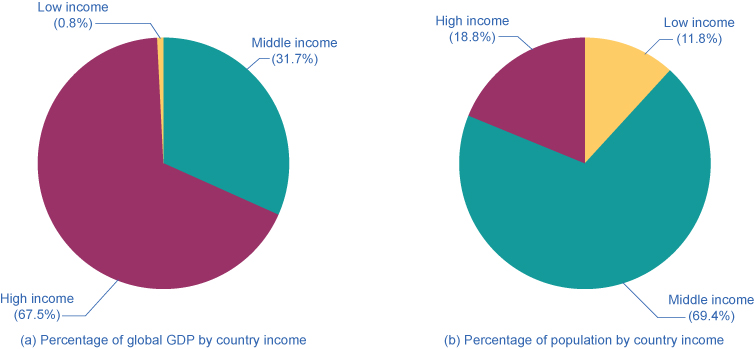
GDP per capita also allows us to rank countries into high-, middle-, or low-income groups. Low-income countries are those with $1,025 per capita GDP per year; middle-income countries have a per capita GDP between $1,025 and $12,475; while high-income countries have over $12,475 per year per capita income. As seen in [link] and [link] , high-income countries earn 68% of world income, but represent just 12% of the global population. Low-income countries earn 1% of total world income, but represent 18.5% of global population.

(Source:http://databank.worldbank.org/data/views/reports/tableview.aspx?isshared=true&ispopular=series&pid=20)
World income versus global population
Ranking based on GDP/capita GDP (in billions) % of Global GDP Population % of Global Population
Low income ($1,025 or less) $612.7 0.8% 848,700,000 11.8%
Middle income ($1,025 - $12,475) $23,930 31.7% 4,970,000,000 69.4%
High income (more than $12,475) $51,090,000,000 67.5% 1,306,000,000 18.8%
World Total income $75,592,941 7,162,119,434

Percent of global gdp and percent of population

The pie charts illustrate the inverse proportionality of global GDP by country to population.
The pie charts show the GDP (from 2011) for countries categorized into low, middle, or high income. Low-income are those earning less than $1,025 (less than 1% of global income). They represent 18.5% of the world population. Middle-income countries are those with per capita income of $1,025–$12,475 (31.1% of global income). They represent 69.5% of world population. High-income countries have 68.3% of global income and 12% of the world’s population. (Source: http://databank.worldbank.org/data/views/reports/tableview.aspx?isshared=true&ispopular=series&pid=20)

Questions & Answers

Ayele, K., 2003. Introductory Economics, 3rd ed., Addis Ababa.
Widad Reply
can you send the book attached ?
Ariel
?
Ariel
What is economics
Widad Reply
the study of how humans make choices under conditions of scarcity
AI-Robot
U(x,y) = (x×y)1/2 find mu of x for y
Desalegn Reply
U(x,y) = (x×y)1/2 find mu of x for y
Desalegn
what is ecnomics
Jan Reply
this is the study of how the society manages it's scarce resources
Belonwu
what is macroeconomic
John Reply
macroeconomic is the branch of economics which studies actions, scale, activities and behaviour of the aggregate economy as a whole.
husaini
etc
husaini
difference between firm and industry
husaini Reply
what's the difference between a firm and an industry
Abdul
firm is the unit which transform inputs to output where as industry contain combination of firms with similar production 😅😅
Abdulraufu
Suppose the demand function that a firm faces shifted from Qd  120 3P to Qd  90  3P and the supply function has shifted from QS  20  2P to QS 10  2P . a) Find the effect of this change on price and quantity. b) Which of the changes in demand and supply is higher?
Toofiq Reply
explain standard reason why economic is a science
innocent Reply
factors influencing supply
Petrus Reply
what is economic.
Milan Reply
scares means__________________ends resources. unlimited
Jan
economics is a science that studies human behaviour as a relationship b/w ends and scares means which have alternative uses
Jan
calculate the profit maximizing for demand and supply
Zarshad Reply
Why qualify 28 supplies
Milan
what are explicit costs
Nomsa Reply
out-of-pocket costs for a firm, for example, payments for wages and salaries, rent, or materials
AI-Robot
concepts of supply in microeconomics
David Reply
economic overview notes
Amahle Reply
identify a demand and a supply curve
Salome Reply
i don't know
Parul
there's a difference
Aryan
Demand curve shows that how supply and others conditions affect on demand of a particular thing and what percent demand increase whith increase of supply of goods
Israr
Hi Sir please how do u calculate Cross elastic demand and income elastic demand?
Abari
Got questions? Join the online conversation and get instant answers!
Jobilize.com Reply

Get Jobilize Job Search Mobile App in your pocket Now!

Get it on Google Play Download on the App Store Now


Source:  OpenStax, Principles of economics. OpenStax CNX. Sep 19, 2014 Download for free at http://legacy.cnx.org/content/col11613/1.11
Google Play and the Google Play logo are trademarks of Google Inc.

Notification Switch

Would you like to follow the 'Principles of economics' conversation and receive update notifications?

Ask