<< Chapter < Page Chapter >> Page >
By the end of this section, you will be able to:
  • Analyze GDP per capita as a measure of the diversity of international standards of living
  • Identify what classifies a country as low-income, middle-income, or high-income
  • Explain how standards of living are influenced by geography, demographics, industry structure, and economic institutions

The national economies that make up the global economy are remarkably diverse. Let us use one key indicator of the standard of living, GDP per capita    , to quantify this diversity. You will quickly see that quantifying this diversity is fraught with challenges and limitations. As explained in The Macroeconomic Perspective , we must consider using purchasing power parity or “international dollars” to convert average incomes into comparable units. Purchasing power parity, as formally defined in Exchange Rates and International Capital Flows , takes into account the fact that prices of the same good are different across countries.

The Macroeconomic Perspective explained how to measure GDP, the challenges of using GDP to compare standards of living, and the difficulty of confusing economic size with distribution. In China's case, for example, China ranks as the second largest global economy, second to only the United States, with Japan being third. But, when we take China's GDP of $9.2 trillion and divide it by its population of 1.4 billion, then the per capita GDP is only $6,900, which is significantly lower than that of Japan, at $38,500, and that of the United States, at $52,800. Measurement issues aside, it’s worth repeating that the goal, then, is to not only increase GDP, but to strive toward increased GDP per capita to increase overall standards of living for individuals. As we have learned from Economic Growth , this can be achieved at the national level by designing policies that increase worker productivity, deepen capital, and advance technology.

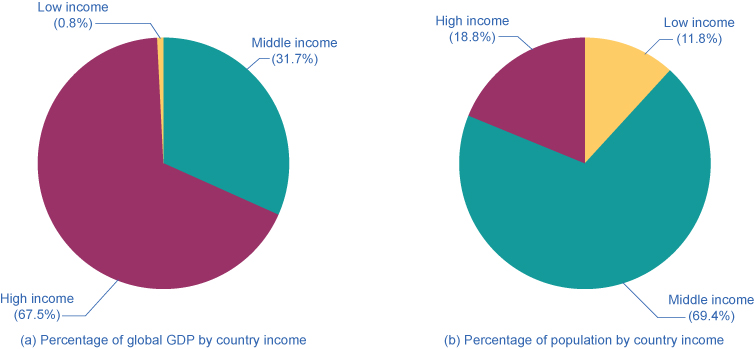
GDP per capita also allows us to rank countries into high-, middle-, or low-income groups. Low-income countries are those with $1,025 per capita GDP per year; middle-income countries have a per capita GDP between $1,025 and $12,475; while high-income countries have over $12,475 per year per capita income. As seen in [link] and [link] , high-income countries earn 68% of world income, but represent just 12% of the global population. Low-income countries earn 1% of total world income, but represent 18.5% of global population.

(Source:http://databank.worldbank.org/data/views/reports/tableview.aspx?isshared=true&ispopular=series&pid=20)
World income versus global population
Ranking based on GDP/capita GDP (in billions) % of Global GDP Population % of Global Population
Low income ($1,025 or less) $612.7 0.8% 848,700,000 11.8%
Middle income ($1,025 - $12,475) $23,930 31.7% 4,970,000,000 69.4%
High income (more than $12,475) $51,090,000,000 67.5% 1,306,000,000 18.8%
World Total income $75,592,941 7,162,119,434

Percent of global gdp and percent of population

The pie charts illustrate the inverse proportionality of global GDP by country to population.
The pie charts show the GDP (from 2011) for countries categorized into low, middle, or high income. Low-income are those earning less than $1,025 (less than 1% of global income). They represent 18.5% of the world population. Middle-income countries are those with per capita income of $1,025–$12,475 (31.1% of global income). They represent 69.5% of world population. High-income countries have 68.3% of global income and 12% of the world’s population. (Source: http://databank.worldbank.org/data/views/reports/tableview.aspx?isshared=true&ispopular=series&pid=20)

Questions & Answers

what is biology
Hajah Reply
the study of living organisms and their interactions with one another and their environments
AI-Robot
what is biology
Victoria Reply
HOW CAN MAN ORGAN FUNCTION
Alfred Reply
the diagram of the digestive system
Assiatu Reply
allimentary cannel
Ogenrwot
How does twins formed
William Reply
They formed in two ways first when one sperm and one egg are splited by mitosis or two sperm and two eggs join together
Oluwatobi
what is genetics
Josephine Reply
Genetics is the study of heredity
Misack
how does twins formed?
Misack
What is manual
Hassan Reply
discuss biological phenomenon and provide pieces of evidence to show that it was responsible for the formation of eukaryotic organelles
Joseph Reply
what is biology
Yousuf Reply
the study of living organisms and their interactions with one another and their environment.
Wine
discuss the biological phenomenon and provide pieces of evidence to show that it was responsible for the formation of eukaryotic organelles in an essay form
Joseph Reply
what is the blood cells
Shaker Reply
list any five characteristics of the blood cells
Shaker
lack electricity and its more savely than electronic microscope because its naturally by using of light
Abdullahi Reply
advantage of electronic microscope is easily and clearly while disadvantage is dangerous because its electronic. advantage of light microscope is savely and naturally by sun while disadvantage is not easily,means its not sharp and not clear
Abdullahi
cell theory state that every organisms composed of one or more cell,cell is the basic unit of life
Abdullahi
is like gone fail us
DENG
cells is the basic structure and functions of all living things
Ramadan
What is classification
ISCONT Reply
is organisms that are similar into groups called tara
Yamosa
in what situation (s) would be the use of a scanning electron microscope be ideal and why?
Kenna Reply
A scanning electron microscope (SEM) is ideal for situations requiring high-resolution imaging of surfaces. It is commonly used in materials science, biology, and geology to examine the topography and composition of samples at a nanoscale level. SEM is particularly useful for studying fine details,
Hilary
cell is the building block of life.
Condoleezza Reply
Got questions? Join the online conversation and get instant answers!
Jobilize.com Reply

Get Jobilize Job Search Mobile App in your pocket Now!

Get it on Google Play Download on the App Store Now


Source:  OpenStax, Principles of economics. OpenStax CNX. Sep 19, 2014 Download for free at http://legacy.cnx.org/content/col11613/1.11
Google Play and the Google Play logo are trademarks of Google Inc.

Notification Switch

Would you like to follow the 'Principles of economics' conversation and receive update notifications?

Ask