<< Chapter < Page Chapter >> Page >
By the end of this section, you will be able to:
  • Analyze GDP per capita as a measure of the diversity of international standards of living
  • Identify what classifies a country as low-income, middle-income, or high-income
  • Explain how standards of living are influenced by geography, demographics, industry structure, and economic institutions

The national economies that make up the global economy are remarkably diverse. Let us use one key indicator of the standard of living, GDP per capita    , to quantify this diversity. You will quickly see that quantifying this diversity is fraught with challenges and limitations. As explained in The Macroeconomic Perspective , we must consider using purchasing power parity or “international dollars” to convert average incomes into comparable units. Purchasing power parity, as formally defined in Exchange Rates and International Capital Flows , takes into account the fact that prices of the same good are different across countries.

The Macroeconomic Perspective explained how to measure GDP, the challenges of using GDP to compare standards of living, and the difficulty of confusing economic size with distribution. In China's case, for example, China ranks as the second largest global economy, second to only the United States, with Japan being third. But, when we take China's GDP of $9.2 trillion and divide it by its population of 1.4 billion, then the per capita GDP is only $6,900, which is significantly lower than that of Japan, at $38,500, and that of the United States, at $52,800. Measurement issues aside, it’s worth repeating that the goal, then, is to not only increase GDP, but to strive toward increased GDP per capita to increase overall standards of living for individuals. As we have learned from Economic Growth , this can be achieved at the national level by designing policies that increase worker productivity, deepen capital, and advance technology.

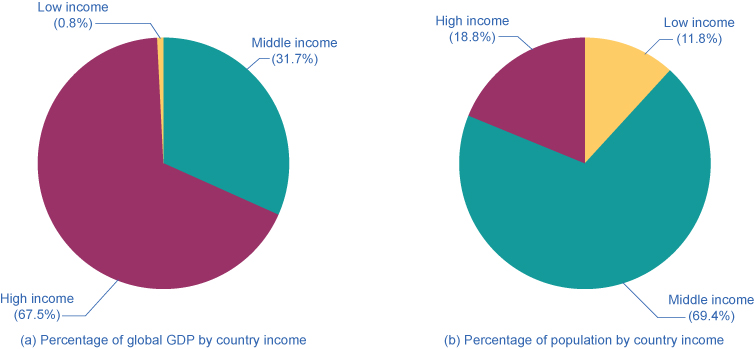
GDP per capita also allows us to rank countries into high-, middle-, or low-income groups. Low-income countries are those with $1,025 per capita GDP per year; middle-income countries have a per capita GDP between $1,025 and $12,475; while high-income countries have over $12,475 per year per capita income. As seen in [link] and [link] , high-income countries earn 68% of world income, but represent just 12% of the global population. Low-income countries earn 1% of total world income, but represent 18.5% of global population.

(Source:http://databank.worldbank.org/data/views/reports/tableview.aspx?isshared=true&ispopular=series&pid=20)
World income versus global population
Ranking based on GDP/capita GDP (in billions) % of Global GDP Population % of Global Population
Low income ($1,025 or less) $612.7 0.8% 848,700,000 11.8%
Middle income ($1,025 - $12,475) $23,930 31.7% 4,970,000,000 69.4%
High income (more than $12,475) $51,090,000,000 67.5% 1,306,000,000 18.8%
World Total income $75,592,941 7,162,119,434

Percent of global gdp and percent of population

The pie charts illustrate the inverse proportionality of global GDP by country to population.
The pie charts show the GDP (from 2011) for countries categorized into low, middle, or high income. Low-income are those earning less than $1,025 (less than 1% of global income). They represent 18.5% of the world population. Middle-income countries are those with per capita income of $1,025–$12,475 (31.1% of global income). They represent 69.5% of world population. High-income countries have 68.3% of global income and 12% of the world’s population. (Source: http://databank.worldbank.org/data/views/reports/tableview.aspx?isshared=true&ispopular=series&pid=20)

Questions & Answers

calculate molarity of NaOH solution when 25.0ml of NaOH titrated with 27.2ml of 0.2m H2SO4
Gasin Reply
what's Thermochemistry
rhoda Reply
the study of the heat energy which is associated with chemical reactions
Kaddija
How was CH4 and o2 was able to produce (Co2)and (H2o
Edafe Reply
explain please
Victory
First twenty elements with their valences
Martine Reply
what is chemistry
asue Reply
what is atom
asue
what is the best way to define periodic table for jamb
Damilola Reply
what is the change of matter from one state to another
Elijah Reply
what is isolation of organic compounds
IKyernum Reply
what is atomic radius
ThankGod Reply
Read Chapter 6, section 5
Dr
Read Chapter 6, section 5
Kareem
Atomic radius is the radius of the atom and is also called the orbital radius
Kareem
atomic radius is the distance between the nucleus of an atom and its valence shell
Amos
Read Chapter 6, section 5
paulino
Bohr's model of the theory atom
Ayom Reply
is there a question?
Dr
when a gas is compressed why it becomes hot?
ATOMIC
It has no oxygen then
Goldyei
read the chapter on thermochemistry...the sections on "PV" work and the First Law of Thermodynamics should help..
Dr
Which element react with water
Mukthar Reply
Mgo
Ibeh
an increase in the pressure of a gas results in the decrease of its
Valentina Reply
definition of the periodic table
Cosmos Reply
What is the lkenes
Da Reply
what were atoms composed of?
Moses Reply
Got questions? Join the online conversation and get instant answers!
Jobilize.com Reply

Get Jobilize Job Search Mobile App in your pocket Now!

Get it on Google Play Download on the App Store Now


Source:  OpenStax, Principles of economics. OpenStax CNX. Sep 19, 2014 Download for free at http://legacy.cnx.org/content/col11613/1.11
Google Play and the Google Play logo are trademarks of Google Inc.

Notification Switch

Would you like to follow the 'Principles of economics' conversation and receive update notifications?

Ask