<< Chapter < Page Chapter >> Page >

By the end of this section, you will be able to:

  • Explain how expansionary fiscal policy can shift aggregate demand and influence the economy
  • Explain how contractionary fiscal policy can shift aggregate demand and influence the economy

We need to emphasize that fiscal policy is the use of government spending and tax policy to alter the economy. Fiscal policy does not include all spending (such as the increase in spending that accompanies a war).

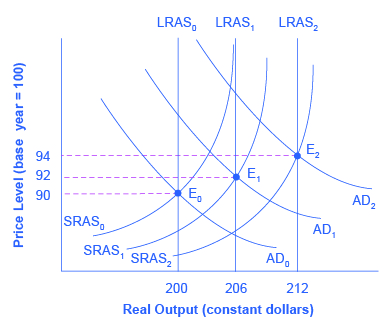
Graphically, we see that fiscal policy, whether through change in spending or taxes, shifts the aggregate demand outward in the case of expansionary fiscal policy    and inward in the case of contractionary fiscal policy    . [link] illustrates the process by using an aggregate demand/aggregate supply diagram in a growing economy. The original equilibrium occurs at E 0 , the intersection of aggregate demand curve AD 0 and aggregate supply curve SRAS 0 , at an output level of 200 and a price level of 90.

One year later, aggregate supply has shifted to the right to SRAS 1 in the process of long-term economic growth, and aggregate demand has also shifted to the right to AD 1 , keeping the economy operating at the new level of potential GDP. The new equilibrium (E 1 ) is an output level of 206 and a price level of 92. One more year later, aggregate supply has again shifted to the right, now to SRAS 2 , and aggregate demand shifts right as well to AD 2 . Now the equilibrium is E 2 , with an output level of 212 and a price level of 94. In short, the figure shows an economy that is growing steadily year to year, producing at its potential GDP each year, with only small inflationary increases in the price level.

A healthy, growing economy

The graph shows three aggregate supply curves, three aggregate demand curves, and three potential GDP lines. Each aggregate demand curve intersects with an aggregate supply curve and the potential GDP line.
In this well-functioning economy, each year aggregate supply and aggregate demand shift to the right so that the economy proceeds from equilibrium E 0 to E 1 to E 2 . Each year, the economy produces at potential GDP with only a small inflationary increase in the price level. But if aggregate demand does not smoothly shift to the right and match increases in aggregate supply, growth with deflation can develop.

Aggregate demand and aggregate supply do not always move neatly together. Aggregate demand may fail to increase along with aggregate supply, or aggregate demand may even shift left, for a number of possible reasons: households become hesitant about consuming; firms decide against investing as much; or perhaps the demand from other countries for exports diminishes. For example, investment by private firms in physical capital in the U.S. economy boomed during the late 1990s, rising from 14.1% of GDP in 1993 to 17.2% in 2000, before falling back to 15.2% by 2002. Conversely, if shifts in aggregate demand run ahead of increases in aggregate supply, inflationary increases in the price level will result. Business cycles of recession and recovery are the consequence of shifts in aggregate supply and aggregate demand.

Monetary Policy and Bank Regulation shows us that a central bank can use its powers over the banking system to engage in countercyclical—or “against the business cycle”—actions. If recession threatens, the central bank uses an expansionary monetary policy to increase the supply of money, increase the quantity of loans, reduce interest rates, and shift aggregate demand to the right. If inflation threatens, the central bank uses contractionary monetary policy to reduce the supply of money, reduce the quantity of loans, raise interest rates, and shift aggregate demand to the left. Fiscal policy is another macroeconomic policy tool for adjusting aggregate demand by using either government spending or taxation policy.

Questions & Answers

it is the relatively stable flow of income
Chidubem Reply
what is circular flow of income
Divine Reply
branches of macroeconomics
SHEDRACK Reply
what is Flexible exchang rate?
poudel Reply
is gdp a reliable measurement of wealth
Atega Reply
introduction to econometrics
Husseini Reply
Hi
mostafa
hi
LEMLEM
hello
Sammol
hi
Mahesh
bi
Ruqayat
hi
Ruqayat
Hi fellas
Nyawa
hey
Sammol
hi
God
hello
Jahara
Good morning
Jorge
hi
abubakar
hi
Nmesoma
hi
Mahesh
Hi
Tom
Why is unemployment rate never zero at full employment?
Priyanka Reply
bcoz of existence of frictional unemployment in our economy.
Umashankar
what is flexible exchang rate?
poudel
due to existence of the pple with disabilities
Abdulraufu
the demand of a good rises, causing the demand for another good to fall
Rushawn Reply
is it possible to leave every good at the same level
Joseph
I don't think so. because check it, if the demand for chicken increases, people will no longer consume fish like they used to causing a fall in the demand for fish
Anuolu
is not really possible to let the value of a goods to be same at the same time.....
Salome
Suppose the inflation rate is 6%, does it mean that all the goods you purchase will cost 6% more than previous year? Provide with reasoning.
Geetha Reply
Not necessarily. To measure the inflation rate economists normally use an averaged price index of a basket of certain goods. So if you purchase goods included in the basket, you will notice that you pay 6% more, otherwise not necessarily.
Waeth
discus major problems of macroeconomics
Alii Reply
what is the problem of macroeconomics
Yoal
Economic growth Stable prices and low unemployment
Ephraim
explain inflationcause and itis degre
Miresa Reply
what is inflation
Getu
increase in general price levels
WEETO
Good day How do I calculate this question: C= 100+5yd G= 2000 T= 2000 I(planned)=200. Suppose the actual output is 3000. What is the level of planned expenditures at this level of output?
Chisomo Reply
how to calculate actual output?
Chisomo
how to calculate the equilibrium income
Beshir
Criteria for determining money supply
Thapase Reply
who we can define macroeconomics in one line
Muhammad
Aggregate demand
Mohammed
C=k100 +9y and i=k50.calculate the equilibrium level of output
Mercy Reply
Hi
Isiaka
Hi
Geli
hy
Man
👋
Bahunda
hy how are you?
Man
ys
Amisha
how are you guys
Sekou
f9 guys
Amisha
how are you guys
Sekou
ys am also fine
Amisha
fine and you guys
Geli
from Nepal
Amisha
nawalparasi district from belatari
Amisha
nd u
Amisha
I am Camara from Guinea west Africa... happy to meet you guys here
Sekou
ma management ho
Amisha
ahile becheclor ho
Amisha
hjr ktm bta ho ani k kaam grnu hunxa tw
Amisha
belatari
Amisha
1st year ho
Amisha
nd u
Amisha
ahh
Amisha
kaha biratnagar
Amisha
ys
Amisha
kina k vo
Amisha
money as unit of account means what?
Kalombe
A unit of account is something that can be used to value goods and services and make calculations
Jim
all of you please speak in English I can't understand you're language
Muhammad
I want to know how can we define macroeconomics in one line
Muhammad
it must be .9 or 0.9 no Mpc is greater than 1 Y=100+.9Y+50 Y-.9Y=150 0.1Y/0.1=150/0.1 Y=1500
Kalombe
Mercy is it clear?😋
Kalombe
hi can someone help me on this question If a negative shocks shifts the IS curve to the left, what type of policy do you suggest so as to stabilize the level of output? discuss your answer using appropriate graph.
Galge Reply
if interest rate is increased this will will reduce the level of income shifting the curve to the left ◀️
Kalombe
Got questions? Join the online conversation and get instant answers!
Jobilize.com Reply

Get Jobilize Job Search Mobile App in your pocket Now!

Get it on Google Play Download on the App Store Now


Source:  OpenStax, Principles of economics. OpenStax CNX. Sep 19, 2014 Download for free at http://legacy.cnx.org/content/col11613/1.11
Google Play and the Google Play logo are trademarks of Google Inc.

Notification Switch

Would you like to follow the 'Principles of economics' conversation and receive update notifications?

Ask