<< Chapter < Page Chapter >> Page >

By the end of this section, you will be able to:

  • Identify equilibrium price and quantity through the four-step process
  • Graph equilibrium price and quantity
  • Contrast shifts of demand or supply and movements along a demand or supply curve
  • Graph demand and supply curves, including equilibrium price and quantity, based on real-world examples

Let’s begin this discussion with a single economic event. It might be an event that affects demand, like a change in income, population, tastes, prices of substitutes or complements, or expectations about future prices. It might be an event that affects supply, like a change in natural conditions, input prices, or technology, or government policies that affect production. How does this economic event affect equilibrium price and quantity? We will analyze this question using a four-step process.

Step 1. Draw a demand and supply model before the economic change took place. To establish the model requires four standard pieces of information: The law of demand, which tells us the slope of the demand curve; the law of supply, which gives us the slope of the supply curve; the shift variables for demand; and the shift variables for supply. From this model, find the initial equilibrium values for price and quantity.

Step 2. Decide whether the economic change being analyzed affects demand or supply. In other words, does the event refer to something in the list of demand factors or supply factors?

Step 3. Decide whether the effect on demand or supply causes the curve to shift to the right or to the left, and sketch the new demand or supply curve on the diagram. In other words, does the event increase or decrease the amount consumers want to buy or producers want to sell?

Step 4. Identify the new equilibrium and then compare the original equilibrium price and quantity to the new equilibrium price and quantity.

Let’s consider one example that involves a shift in supply and one that involves a shift in demand. Then we will consider an example where both supply and demand shift.

Good weather for salmon fishing

In the summer of 2000, weather conditions were excellent for commercial salmon fishing off the California coast. Heavy rains meant higher than normal levels of water in the rivers, which helps the salmon to breed. Slightly cooler ocean temperatures stimulated the growth of plankton, the microscopic organisms at the bottom of the ocean food chain, providing everything in the ocean with a hearty food supply. The ocean stayed calm during fishing season, so commercial fishing operations did not lose many days to bad weather. How did these climate conditions affect the quantity and price of salmon? [link] illustrates the four-step approach, which is explained below, to work through this problem. [link] provides the information to work the problem as well.
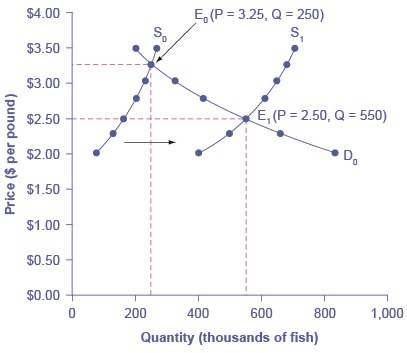
Good weather for salmon fishing: the four-step process

The graph represents the four-step approach to determining shifts in the new equilibrium price and quantity in response to good weather for salmon fishing.
Unusually good weather leads to changes in the price and quantity of salmon.
Salmon fishing
Price per Pound Quantity Supplied in 1999 Quantity Supplied in 2000 Quantity Demanded
$2.00 80 400 840
$2.25 120 480 680
$2.50 160 550 550
$2.75 200 600 450
$3.00 230 640 350
$3.25 250 670 250
$3.50 270 700 200

Questions & Answers

Ayele, K., 2003. Introductory Economics, 3rd ed., Addis Ababa.
Widad Reply
can you send the book attached ?
Ariel
?
Ariel
What is economics
Widad Reply
the study of how humans make choices under conditions of scarcity
AI-Robot
U(x,y) = (x×y)1/2 find mu of x for y
Desalegn Reply
U(x,y) = (x×y)1/2 find mu of x for y
Desalegn
what is ecnomics
Jan Reply
this is the study of how the society manages it's scarce resources
Belonwu
what is macroeconomic
John Reply
macroeconomic is the branch of economics which studies actions, scale, activities and behaviour of the aggregate economy as a whole.
husaini
etc
husaini
difference between firm and industry
husaini Reply
what's the difference between a firm and an industry
Abdul
firm is the unit which transform inputs to output where as industry contain combination of firms with similar production 😅😅
Abdulraufu
Suppose the demand function that a firm faces shifted from Qd  120 3P to Qd  90  3P and the supply function has shifted from QS  20  2P to QS 10  2P . a) Find the effect of this change on price and quantity. b) Which of the changes in demand and supply is higher?
Toofiq Reply
explain standard reason why economic is a science
innocent Reply
factors influencing supply
Petrus Reply
what is economic.
Milan Reply
scares means__________________ends resources. unlimited
Jan
economics is a science that studies human behaviour as a relationship b/w ends and scares means which have alternative uses
Jan
calculate the profit maximizing for demand and supply
Zarshad Reply
Why qualify 28 supplies
Milan
what are explicit costs
Nomsa Reply
out-of-pocket costs for a firm, for example, payments for wages and salaries, rent, or materials
AI-Robot
concepts of supply in microeconomics
David Reply
economic overview notes
Amahle Reply
identify a demand and a supply curve
Salome Reply
i don't know
Parul
there's a difference
Aryan
Demand curve shows that how supply and others conditions affect on demand of a particular thing and what percent demand increase whith increase of supply of goods
Israr
Hi Sir please how do u calculate Cross elastic demand and income elastic demand?
Abari
Got questions? Join the online conversation and get instant answers!
Jobilize.com Reply

Get Jobilize Job Search Mobile App in your pocket Now!

Get it on Google Play Download on the App Store Now


Source:  OpenStax, Principles of economics. OpenStax CNX. Sep 19, 2014 Download for free at http://legacy.cnx.org/content/col11613/1.11
Google Play and the Google Play logo are trademarks of Google Inc.

Notification Switch

Would you like to follow the 'Principles of economics' conversation and receive update notifications?

Ask