

| << Chapter < Page | Chapter >> Page > |
By the end of this section, you will be able to:
Most Americans would be outraged if a law prevented them from moving to another city or another state. However, when the conversation turns to crossing national borders and are about other people arriving in the United States, laws preventing such movement often seem more reasonable. Some of the tensions over immigration stem from worries over how it might affect a country’s culture, including differences in language, and patterns of family, authority, or gender relationships. Economics does not have much to say about such cultural issues. Some of the worries about immigration do, however, have to do with its effects on wages and income levels, and how it affects government taxes and spending. On those topics, economists have insights and research to offer.
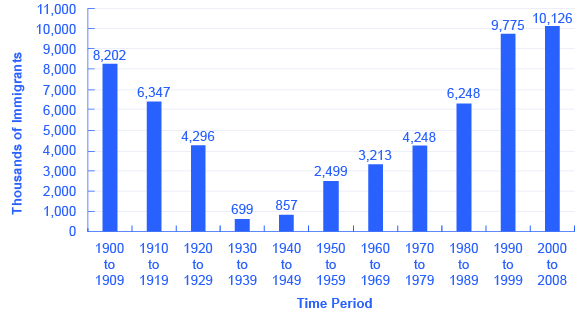
Supporters and opponents of immigration look at the same data and see different patterns. Those who express concern about immigration levels to the United States point to graphics like [link] which shows total inflows of immigrants decade by decade through the twentieth century. Clearly, the level of immigration has been high and rising in recent years, reaching and exceeding the towering levels of the early twentieth century. However, those who are less worried about immigration point out that the high immigration levels of the early twentieth century happened when total population was much lower. Since the U.S. population roughly tripled during the twentieth century, the seemingly high levels in immigration in the 1990s and 2000s look relatively smaller when they are divided by the population.
Where have the immigrants come from? Immigrants from Europe were more than 90% of the total in the first decade of the twentieth century, but less than 20% of the total by the end of the century. By the 2000s, about half of U.S. immigration came from the rest of the Americas, especially Mexico, and about a quarter came from various countries in Asia.
A surge of immigration can affect the economy in a number of different ways. In this section, we will consider how immigrants might benefit the rest of the economy, how they might affect wage levels, and how they might affect government spending at the federal and local level.
To understand the economic consequences of immigration, consider the following scenario. Imagine that the immigrants entering the United States matched the existing U.S. population in age range, education, skill levels, family size, occupations, and so on. How would immigration of this type affect the rest of the U.S. economy? Immigrants themselves would be much better off, because their standard of living would be higher in the United States. Immigrants would contribute to both increased production and increased consumption. Given enough time for adjustment, the range of jobs performed, income earned, taxes paid, and public services needed would not be much affected by this kind of immigration. It would be as if the population simply increased a little.
Notification Switch
Would you like to follow the 'Principles of economics' conversation and receive update notifications?

|
|

|
|

|
|

|
|

|
|

|
|

|
|

|
|

|
|

|
|

|