

| << Chapter < Page | Chapter >> Page > |
SNAP can contribute to the poverty trap. For every $100 earned, the government assumes that a family can spend $30 more for food, and thus reduces its eligibility for food aid by $30. This decreased benefit is not a complete disincentive to work—but combined with how other programs reduce benefits as income increases, it adds to the problem. SNAP, however, does try to address the poverty trap with its own set of work requirements and time limits.
Why give debit cards and not just cash? Part of the political support for SNAP comes from a belief that since the cards must be spent on food, they cannot be “wasted” on other forms of consumption. From an economic point of view, however, the belief that cards must increase spending on food seems wrong-headed. After all, say that a poor family is spending $2,500 per year on food, and then it starts receiving $1,000 per year in SNAP aid. The family might react by spending $3,500 per year on food (income plus aid), or it might react by continuing to spend $2,500 per year on food, but use the $1,000 in food aid to free up $1,000 that can now be spent on other goods. So it is reasonable to think of SNAP cards as an alternative method, along with TANF and the earned income tax credit, of transferring income to the working poor.
Indeed, anyone eligible for TANF is also eligible for SNAP, although states can expand eligibility for food aid if they wish to do so. In some states, where TANF welfare spending is relatively low, a poor family may receive more in support from SNAP than from TANF. In 2014, about 40 million people received food aid at an annual cost of about $76 billion, with an average monthly benefit of about $287 per person per month. SNAP participation increased by 70% between 2007 and 2011, from 26.6 million participants to 45 million. According to the Congressional Budget Office, this dramatic rise in participation was caused by the Great Recession of 2008–2009 and rising food prices.
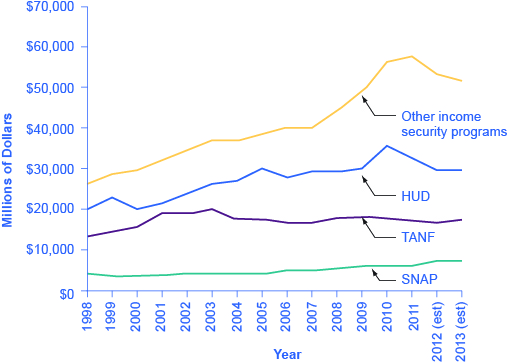
The federal government deploys a range of income security programs that are funded through departments such as Health and Human Services, Agriculture, and Housing and Urban Development (HUD) (see [link] ). According to the Office of Management and Budget, collectively, these three departments provided an estimated $62 billion of aid through programs such as supplemental feeding programs for women and children, subsidized housing, and energy assistance. The federal government also transfers funds to individual states through special grant programs.
Notification Switch
Would you like to follow the 'Principles of economics' conversation and receive update notifications?

|
|
|
|
|

|
|

|
|

|
|

|
|

|
|

|
|

|
|

|
|

|
|

|