<< Chapter < Page Chapter >> Page >

Wiskunde

Graad 9

Getalpatrone

Grafiese voorstellings

Vergelykings

Statistiek

Waarskynlikheidsleer

Module 12

Getalpatrone

Aktiwiteit 1

Om ‘n tabel te gebruik om inligting te organiseer

[lu 2.1, 2.2]

Alice maak hangertjies deur driehoek–motiewe op ‘n draadjie te plaas (soos in diagram 1). Elke motief bestaan uit drie swart krale, ses wit krale en ses gekleurde krale. Dis vir haar belangrik om genoeg krale van elke kleur te koop. Sy wil 50 hangertjies met swart, wit en rooi krale maak; 40 met swart, wit en geel krale; 40 met swart, wit en blou krale en 30 met swart,wit en groen krale.

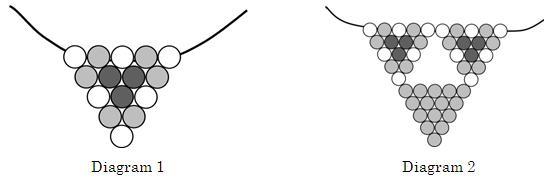
1. Vraag: Bereken hoeveel krale van elke kleur sy moet koop.

Sy maak ook ‘n groter hangertjie (soos in diagram 2) waar sy drie motiewe kombineer. Die twee boonste motiewe is dieselfde ontwerp as in diagram 1, maar die onderste motief bestaan slegs uit 15 gekleurde krale. Van hierdie hangertjies maak sy net die helfte soveel in elke kleur as die eenvoudige hangertjie.

2. Vraag: Hoeveel krale van elke kleur benodig sy vir hierdie hangertjies?

Die groter hangertjies is bo verwagting gewild, dus besluit sy om groter motiewe te ontwerp en om meer motiewe per hangertjie te gebruik. Die volgende twee diagramme toon haar nuwe planne.

Alice wil vier kleure kombineer in elke motief. Gebruik die diagram om jou eie vier–kleur ontwerp te maak.

3. Vraag: Herhaal die berekening–oefeninge vir hierdie hangertjies.

Hierdie driehoek-motiewe kan natuurlik groter en groter gemaak word. Almal is egter nie geskik vir hangertjies nie!

4. Oefening: Hieronder is gelyksydige driehoek–motiewe 1 tot 4. Teken motiewe 6 en 7 wat verder volg.

Die derde motief hierbo het 1 swart, 3 wit en 6 rooi krale. Jy sal hierna moet verwys in probleem 6 verder aan.

5. Data–insameling: Die krale in die motiewe het elk ‘n deursnit van 1cm. Dus is die sylengte van die eerste motief in die gegewe volgorde 2 cm. Voltooi die tabel hieronder deur na die driehoeke hierbo, asook dié wat jy geteken het, te verwys.

Sylengte van driehoek in sentimeter 2 3 4 5 6 7 8
Aantal krale per driehoek 3 6 10
Omtrek van driehoek 6 9

6. Ondersoek: Alice maak haar hangertjies deur driehoekmotiewe te kombineer soos in diagram 2 en 4. As sy die 10–kraalmotief gebruik, het die kleinste hanger een motief (grootte 1) en die volgende hanger het drie motiewe (grootte 2) met ‘n driehoek–vormige spasie in die middel. Dink hoe die volgende groottes hangertjies (3, 4, ens.) gaan lyk (of teken hulle) en voltooi onderstaande tabel. Probeer om die laaste kolom ook te voltooi!

Hangertjie–grootte 1 2 3 4 5 Х
Aantal driehoekmotiewe 6 10
Aantal driehoekspasies
Aantal krale per sy van elke driehoekmotief
Totale aantal krale per hangertjie
Aantal swart krale
Totale omtrek van hanger met 1cm krale 9

6. Ondersoek: Doen dieselfde vir die volgende tabel as Alice nou die 15–kraalmotief gebruik (sien die heel eerste diagram).

Hangertjie–grootte 1 2 3 4 5 Х
Aantal driehoekmotiewe 1 3
Aantal driehoekspasies 0 1
Aantal krale per sy van elke driehoekmotief 5 10
Totale aantal krale per hangertjie 15 45
Aantal swart krale 3 9
Totale omtrek van hanger met 1cm krale 12 27

Questions & Answers

differentiate between demand and supply giving examples
Lambiv Reply
differentiated between demand and supply using examples
Lambiv
what is labour ?
Lambiv
how will I do?
Venny Reply
how is the graph works?I don't fully understand
Rezat Reply
information
Eliyee
devaluation
Eliyee
t
WARKISA
hi guys good evening to all
Lambiv
multiple choice question
Aster Reply
appreciation
Eliyee
explain perfect market
Lindiwe Reply
In economics, a perfect market refers to a theoretical construct where all participants have perfect information, goods are homogenous, there are no barriers to entry or exit, and prices are determined solely by supply and demand. It's an idealized model used for analysis,
Ezea
What is ceteris paribus?
Shukri Reply
other things being equal
AI-Robot
When MP₁ becomes negative, TP start to decline. Extuples Suppose that the short-run production function of certain cut-flower firm is given by: Q=4KL-0.6K2 - 0.112 • Where is quantity of cut flower produced, I is labour input and K is fixed capital input (K-5). Determine the average product of lab
Kelo
Extuples Suppose that the short-run production function of certain cut-flower firm is given by: Q=4KL-0.6K2 - 0.112 • Where is quantity of cut flower produced, I is labour input and K is fixed capital input (K-5). Determine the average product of labour (APL) and marginal product of labour (MPL)
Kelo
yes,thank you
Shukri
Can I ask you other question?
Shukri
what is monopoly mean?
Habtamu Reply
What is different between quantity demand and demand?
Shukri Reply
Quantity demanded refers to the specific amount of a good or service that consumers are willing and able to purchase at a give price and within a specific time period. Demand, on the other hand, is a broader concept that encompasses the entire relationship between price and quantity demanded
Ezea
ok
Shukri
how do you save a country economic situation when it's falling apart
Lilia Reply
what is the difference between economic growth and development
Fiker Reply
Economic growth as an increase in the production and consumption of goods and services within an economy.but Economic development as a broader concept that encompasses not only economic growth but also social & human well being.
Shukri
production function means
Jabir
What do you think is more important to focus on when considering inequality ?
Abdisa Reply
any question about economics?
Awais Reply
sir...I just want to ask one question... Define the term contract curve? if you are free please help me to find this answer 🙏
Asui
it is a curve that we get after connecting the pareto optimal combinations of two consumers after their mutually beneficial trade offs
Awais
thank you so much 👍 sir
Asui
In economics, the contract curve refers to the set of points in an Edgeworth box diagram where both parties involved in a trade cannot be made better off without making one of them worse off. It represents the Pareto efficient allocations of goods between two individuals or entities, where neither p
Cornelius
In economics, the contract curve refers to the set of points in an Edgeworth box diagram where both parties involved in a trade cannot be made better off without making one of them worse off. It represents the Pareto efficient allocations of goods between two individuals or entities,
Cornelius
Suppose a consumer consuming two commodities X and Y has The following utility function u=X0.4 Y0.6. If the price of the X and Y are 2 and 3 respectively and income Constraint is birr 50. A,Calculate quantities of x and y which maximize utility. B,Calculate value of Lagrange multiplier. C,Calculate quantities of X and Y consumed with a given price. D,alculate optimum level of output .
Feyisa Reply
Answer
Feyisa
c
Jabir
the market for lemon has 10 potential consumers, each having an individual demand curve p=101-10Qi, where p is price in dollar's per cup and Qi is the number of cups demanded per week by the i th consumer.Find the market demand curve using algebra. Draw an individual demand curve and the market dema
Gsbwnw Reply
suppose the production function is given by ( L, K)=L¼K¾.assuming capital is fixed find APL and MPL. consider the following short run production function:Q=6L²-0.4L³ a) find the value of L that maximizes output b)find the value of L that maximizes marginal product
Abdureman
types of unemployment
Yomi Reply
What is the difference between perfect competition and monopolistic competition?
Mohammed
Got questions? Join the online conversation and get instant answers!
Jobilize.com Reply

Get Jobilize Job Search Mobile App in your pocket Now!

Get it on Google Play Download on the App Store Now


Source:  OpenStax, Wiskunde graad 9. OpenStax CNX. Sep 14, 2009 Download for free at http://cnx.org/content/col11055/1.1
Google Play and the Google Play logo are trademarks of Google Inc.

Notification Switch

Would you like to follow the 'Wiskunde graad 9' conversation and receive update notifications?

Ask