<< Chapter < Page Chapter >> Page >

Outcome

An outcome of an experiment is a single result of that experiment.

  • A possible outcome of Experiment 1: the value on the top face is '3'
  • A possible outcome of Experiment 2: the total value on the top faces is '9'

Sample space

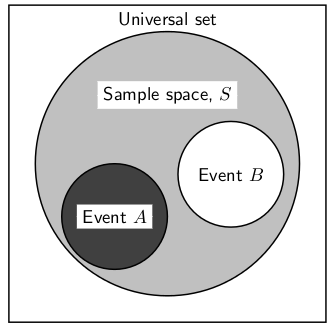
The sample space of an experiment is the complete set of possible outcomes of the experiment.

  • Experiment 1: the sample space is 1,2,3,4,5,6
  • Experiment 2: the sample space is 2,3,4,5,6,7,8,9,10,11,12

Interesting fact

If you roll two die and add the results, the most common outcome is 7. To understand this, think that there is only one way to get 2 as a result (both dice landing with 1) and there is only way to get 12 as a result (both dice landing with 6). The opposite sides of a six sided dice add up to 7. From this you should be able to work out that there are 12 ways to get a 7.

Event

An event is any set of outcomes of an experiment.

  • A possible event of Experiment 1: an even number being on the top face of the die
  • A possible event of Experiment 2: the numbers on the top face of each die being equal

Random experiments

The term random experiment or statistical experiment is used to describe any repeatable process, the results of which are analyzed in some way. For example, flipping a coin and noting whetheror not it lands heads-up is a random experiment because the process is repeatable. On the other hand, your reading this sentence for the first time andnoting whether you understand it is not a random experiment because it is not repeatable (though making a number of random people read it and noting whichones understand it would turn it into a random experiment).

Venn diagrams

A Venn diagram can be used to show the relationship between the possible outcomes of a random experiment and thesample space. The Venn diagram in [link] shows the difference between the universal set, a sample space and events and outcomes as subsets ofthe sample space.

Diagram to show difference between the universal set and the sample space. The sample space is made up of all possible outcomes of astatistical experiment and an event is a subset of the sample space.

We can draw Venn diagrams for experiments with two and three events. These are shown in [link] and [link] . Venn diagrams for experiments with more than three events are more complex and are not covered at this level.
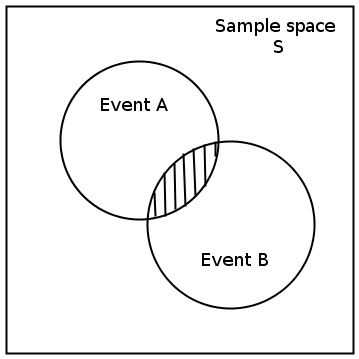
Venn diagram for an experiment with two events
Venn diagram for an experiment with three events.

Interesting fact

The Greek, Russian and Latin alphabets can be illustrated using Venn diagrams. All these alphabets have some common letters. The Venn diagram is given below:

The union of A and B is the set of all elements in A or in B (or in both). A or B is also written A B . The intersection of A and B is the set of all elements in both A and B . A and B is also written as A B .

Venn diagrams can also be used to indicate the union and intersection between events in a sample space ( [link] and [link] ).

Venn diagram to show (left) union of two events, A and B , in the sample space S .
Venn diagram to show intersection of two events A and B , in the sample space S . The black region indicates the intersection.

Questions & Answers

differentiate between demand and supply giving examples
Lambiv Reply
differentiated between demand and supply using examples
Lambiv
what is labour ?
Lambiv
how will I do?
Venny Reply
how is the graph works?I don't fully understand
Rezat Reply
information
Eliyee
devaluation
Eliyee
t
WARKISA
hi guys good evening to all
Lambiv
multiple choice question
Aster Reply
appreciation
Eliyee
explain perfect market
Lindiwe Reply
In economics, a perfect market refers to a theoretical construct where all participants have perfect information, goods are homogenous, there are no barriers to entry or exit, and prices are determined solely by supply and demand. It's an idealized model used for analysis,
Ezea
What is ceteris paribus?
Shukri Reply
other things being equal
AI-Robot
When MP₁ becomes negative, TP start to decline. Extuples Suppose that the short-run production function of certain cut-flower firm is given by: Q=4KL-0.6K2 - 0.112 • Where is quantity of cut flower produced, I is labour input and K is fixed capital input (K-5). Determine the average product of lab
Kelo
Extuples Suppose that the short-run production function of certain cut-flower firm is given by: Q=4KL-0.6K2 - 0.112 • Where is quantity of cut flower produced, I is labour input and K is fixed capital input (K-5). Determine the average product of labour (APL) and marginal product of labour (MPL)
Kelo
yes,thank you
Shukri
Can I ask you other question?
Shukri
what is monopoly mean?
Habtamu Reply
What is different between quantity demand and demand?
Shukri Reply
Quantity demanded refers to the specific amount of a good or service that consumers are willing and able to purchase at a give price and within a specific time period. Demand, on the other hand, is a broader concept that encompasses the entire relationship between price and quantity demanded
Ezea
ok
Shukri
how do you save a country economic situation when it's falling apart
Lilia Reply
what is the difference between economic growth and development
Fiker Reply
Economic growth as an increase in the production and consumption of goods and services within an economy.but Economic development as a broader concept that encompasses not only economic growth but also social & human well being.
Shukri
production function means
Jabir
What do you think is more important to focus on when considering inequality ?
Abdisa Reply
any question about economics?
Awais Reply
sir...I just want to ask one question... Define the term contract curve? if you are free please help me to find this answer 🙏
Asui
it is a curve that we get after connecting the pareto optimal combinations of two consumers after their mutually beneficial trade offs
Awais
thank you so much 👍 sir
Asui
In economics, the contract curve refers to the set of points in an Edgeworth box diagram where both parties involved in a trade cannot be made better off without making one of them worse off. It represents the Pareto efficient allocations of goods between two individuals or entities, where neither p
Cornelius
In economics, the contract curve refers to the set of points in an Edgeworth box diagram where both parties involved in a trade cannot be made better off without making one of them worse off. It represents the Pareto efficient allocations of goods between two individuals or entities,
Cornelius
Suppose a consumer consuming two commodities X and Y has The following utility function u=X0.4 Y0.6. If the price of the X and Y are 2 and 3 respectively and income Constraint is birr 50. A,Calculate quantities of x and y which maximize utility. B,Calculate value of Lagrange multiplier. C,Calculate quantities of X and Y consumed with a given price. D,alculate optimum level of output .
Feyisa Reply
Answer
Feyisa
c
Jabir
the market for lemon has 10 potential consumers, each having an individual demand curve p=101-10Qi, where p is price in dollar's per cup and Qi is the number of cups demanded per week by the i th consumer.Find the market demand curve using algebra. Draw an individual demand curve and the market dema
Gsbwnw Reply
suppose the production function is given by ( L, K)=L¼K¾.assuming capital is fixed find APL and MPL. consider the following short run production function:Q=6L²-0.4L³ a) find the value of L that maximizes output b)find the value of L that maximizes marginal product
Abdureman
types of unemployment
Yomi Reply
What is the difference between perfect competition and monopolistic competition?
Mohammed
Got questions? Join the online conversation and get instant answers!
Jobilize.com Reply

Get Jobilize Job Search Mobile App in your pocket Now!

Get it on Google Play Download on the App Store Now


Source:  OpenStax, Siyavula textbooks: grade 10 maths [caps]. OpenStax CNX. Aug 03, 2011 Download for free at http://cnx.org/content/col11306/1.4
Google Play and the Google Play logo are trademarks of Google Inc.

Notification Switch

Would you like to follow the 'Siyavula textbooks: grade 10 maths [caps]' conversation and receive update notifications?

Ask