

| << Chapter < Page | Chapter >> Page > |
A Venn diagram is a picture that represents the outcomes of an experiment. It generally consists of a box that represents the sample space S together with circles or ovals. The circles or ovals represent events. Venn diagrams also help us to convert common English words into mathematical terms that help add precision.
Venn diagrams are named for their inventor, John Venn, a mathematics professor at Cambridge and an Anglican minister. His main work was conducted during the late 1870's and gave rise to a whole branch of mathematics and a new way to approach issues of logic. We will develop the probability rules just covered using this powerful way to demonstrate the probability postulates including the Addition Rule, Multiplication Rule, Complement Rule, Independence, and Conditional Probability.
Suppose an experiment has the outcomes 1, 2, 3, ... , 12 where each outcome has an equal chance of occurring. Let event A = {1, 2, 3, 4, 5, 6} and event B = {6, 7, 8, 9}. Then and . The Venn diagram is as follows:
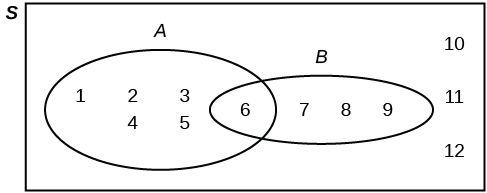
[link] shows the most basic relationship among these numbers. First, the numbers are in groups called sets; set A and set B. Some number are in both sets; we say in set A in set B. The English word "and" means inclusive, meaning having the characteristics of both A and B, or in this case, being a part of both A and B. This condition is called the INTERSECTION of the two sets. All members that are part of both sets constitute the intersection of the two sets. The intersection is written as where is the mathematical symbol for intersection. The statement is read as "A intersect B." You can remember this by thinking of the intersection of two streets.
There are also those numbers that form a group that, for membership, the number must be in either one or the other group. The number does not have to be in BOTH groups, but instead only in either one of the two. These numbers are called the UNION of the two sets and in this case they are the numbers 1-5 (from A exclusively), 7-9 (from set B exclusively) and also 6, which is in both sets A and B. The symbol for the UNION is , thus numbers 1-9, but excludes number 10, 11, and 12. The values 10, 11, and 12 are part of the universe, but are not in either of the two sets.
Translating the English word "AND" into the mathematical logic symbol , intersection, and the word "OR" into the mathematical symbol , union, provides a very precise way to discuss the issues of probability and logic. The general terminology for the three areas of the Venn diagram in [link] is shown in [link] .
Suppose an experiment has outcomes black, white, red, orange, yellow, green, blue, and purple, where each outcome has an equal chance of occurring. Let event C = {green, blue, purple} and event P = {red, yellow, blue}. Then and . Draw a Venn diagram representing this situation.

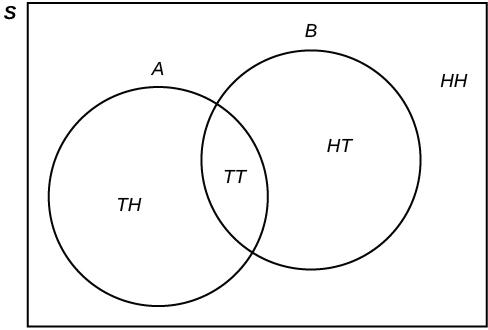
Flip two fair coins. Let A = tails on the first coin. Let B = tails on the second coin. Then A = { TT , TH } and B = { TT , HT }. Therefore, . .
The sample space when you flip two fair coins is X = { HH , HT , TH , TT }. The outcome HH is in NEITHER A NOR B . The Venn diagram is as follows:
Notification Switch
Would you like to follow the 'Introductory statistics' conversation and receive update notifications?

|
|

|
|

|
|

|
|
|
|
|

|
|

|
|

|
|

|
|
|
|