

| << Chapter < Page | Chapter >> Page > |
To save the created VI for later use, choose File → Save from the menu or press<Ctrl-S>to bring up a dialog window to enter a name. Type “Sum and Average” as the VI name and click Save .
To test the functionality of the VI, enter some sample values in the numeric controls on the front panel and run the VI by choosing Operate → Run , by pressing<Ctrl-R>or by clicking the Run button on the toolbar. From the displayed output values in the numeric indicators, the functionality of the VI can be verified. [link] illustrates the outcome after running the VI with two inputs, 10 and 15.

If it is desired to use a VI as part of a higher-level VI, one needs to configure its connector pane. A connector pane assigns inputs and outputs of a subVI to its terminals through which data are exchanged.
The default pattern of a connector pane is determined based on the number of controls and indicators. In general, the terminals on the left side of a connector pane pattern are used for inputs and the ones on the right side for outputs. One can add terminals to or remove them from a connector pane by right-clicking and choosing Add Terminal or Remove Terminal from the shortcut menu. If the number of inputs/outputs or the distribution of terminals are changed, the connector pane pattern can be replaced with a new one by right-clicking and choosing Patterns from the shortcut menu. Once a pattern is selected, one needs to reassign each terminal to a control or an indicator by using the Wiring tool or by enabling the automatic tool selection mode.
[link] a illustrates how to assign a Sum and Average VI terminal to a numeric control. The completed connector pane is shown in [link] b. Notice that the output terminals have thicker borders. The color of a terminal reflects its data type.

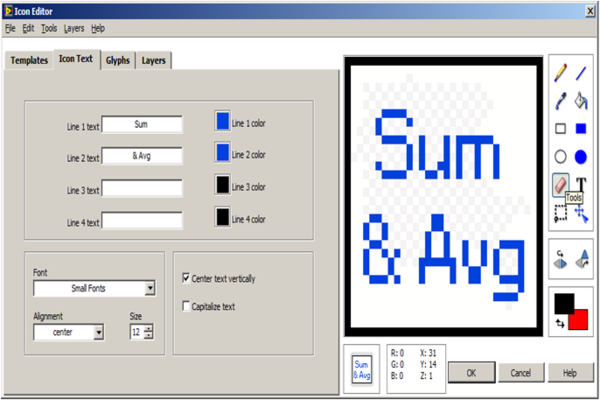
Considering that a subVI icon is displayed on the block diagram of a higher-level VI, it is important to edit the subVI icon for it to be explicitly identifiable. Double-clicking on the top-right corner icon of a block diagram opens the Icon Editor. The Icon Editor tools are similar to those in other graphical editors, such as Microsoft Paint. Editing the Sum and Average VI icon is illustrated in [link] .
A subVI can also be created from a section of a VI. To do so, select the nodes on the block diagram to be included in the subVI, as shown in [link] a. Then, choose Edit → Create SubVI to insert a new subVI icon. [link] b illustrates the block diagram with an inserted subVI. One can open and edit this subVI by double-clicking on its icon on the block diagram. Save this subVI as Sum and Average.vi . This subVI performs the same function as the original Sum and Average VI.

Now let us consider another example to understand the use of structures and subVIs. In this example, we use a VI to show the sum and average of two input values, which are altered in a continuous fashion. If the average of the two inputs becomes greater than a preset threshold value, a LED warning light turns on.
Notification Switch
Would you like to follow the 'An interactive approach to signals and systems laboratory' conversation and receive update notifications?

|
|

|
|

|
|

|
|
|
|
|

|
|

|
|

|
|

|
|

|