<< Chapter < Page Chapter >> Page >

The relationships between the three common temperature scales is shown in [link] .

Temperature ranges in the universe

[link] shows the wide range of temperatures found in the universe. Human beings have been known to survive with body temperatures within a small range, from 24 º C size 12{"24"°C} {} to 44 º C size 12{"44"°C} {} ( 75 º F size 12{ \( "75"°F} {} to 111 º F size 12{"111"°F} {} ). The average normal body temperature is usually given as 37 . 0 º C size 12{"37" "." 0°C} {} ( 98 . 6 º F size 12{"98" "." 6°F} {} ), and variations in this temperature can indicate a medical condition: a fever, an infection, a tumor, or circulatory problems (see [link] ).
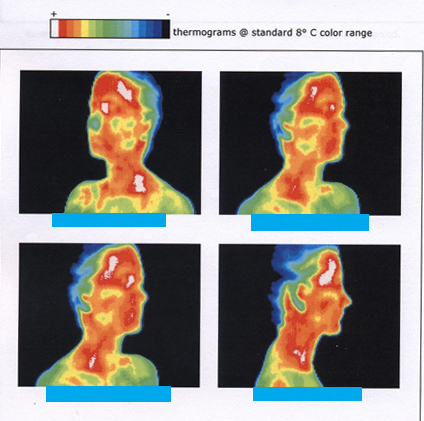
This figure consists of four different infrared thermographs of a person's head and neck, taken when the person's head was positioned at four different angles. The person's face and neck are mostly red and orange, with patches of white, green, and yellow. The red and white colors correspond to hot areas. The person's hair ranges in color from green to light blue to dark blue. The blue color corresponds to cold areas.
This image of radiation from a person’s body (an infrared thermograph) shows the location of temperature abnormalities in the upper body. Dark blue corresponds to cold areas and red to white corresponds to hot areas. An elevated temperature might be an indication of malignant tissue (a cancerous tumor in the breast, for example), while a depressed temperature might be due to a decline in blood flow from a clot. In this case, the abnormalities are caused by a condition called hyperhidrosis. (credit: Porcelina81, Wikimedia Commons)

The lowest temperatures ever recorded have been measured during laboratory experiments: 4 . 5 × 10 10 K size 12{4 "." 5 times "10" rSup { size 8{–"10"} } " K"} {} at the Massachusetts Institute of Technology (USA), and 1 . 0 × 10 10 K size 12{1 "." 0 times "10" rSup { size 8{–"10"} } " K"} {} at Helsinki University of Technology (Finland). In comparison, the coldest recorded place on Earth’s surface is Vostok, Antarctica at 183 K ( 89 º C ) size 12{ \( –"89"°C \) } {} , and the coldest place (outside the lab) known in the universe is the Boomerang Nebula, with a temperature of 1 K.

The figure is a single vertical axis showing a wide range of temperatures on a logarithmic scale, measured in kelvin. The temperature range goes from the lowest temperature achieved at ten to the power of negative ten kelvin up to the temperature in experiments at the Relativistic Heavy Ion Collider at ten to the power of positive twelve kelvin.
Each increment on this logarithmic scale indicates an increase by a factor of ten, and thus illustrates the tremendous range of temperatures in nature. Note that zero on a logarithmic scale would occur off the bottom of the page at infinity.

Making connections: absolute zero

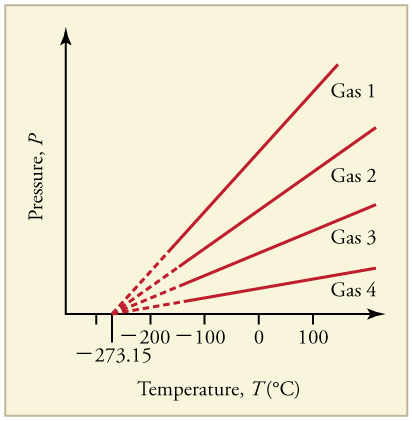
What is absolute zero? Absolute zero is the temperature at which all molecular motion has ceased. The concept of absolute zero arises from the behavior of gases. [link] shows how the pressure of gases at a constant volume decreases as temperature decreases. Various scientists have noted that the pressures of gases extrapolate to zero at the same temperature, 273 . 15 º C size 12{–"273" "." "15"°C} {} . This extrapolation implies that there is a lowest temperature. This temperature is called absolute zero . Today we know that most gases first liquefy and then freeze, and it is not actually possible to reach absolute zero. The numerical value of absolute zero temperature is 273 . 15 º C size 12{–"273" "." "15"°C} {} or 0 K.

Line graph of pressure versus temperature of five gases. Each graph is linear with a positive slope. Each line extrapolates to a pressure of zero at a temperature of negative two hundred seventy three point one five degrees Celsius.
Graph of pressure versus temperature for various gases kept at a constant volume. Note that all of the graphs extrapolate to zero pressure at the same temperature.

Thermal equilibrium and the zeroth law of thermodynamics

Thermometers actually take their own temperature, not the temperature of the object they are measuring. This raises the question of how we can be certain that a thermometer measures the temperature of the object with which it is in contact. It is based on the fact that any two systems placed in thermal contact (meaning heat transfer can occur between them) will reach the same temperature. That is, heat will flow from the hotter object to the cooler one until they have exactly the same temperature. The objects are then in thermal equilibrium    , and no further changes will occur. The systems interact and change because their temperatures differ, and the changes stop once their temperatures are the same. Thus, if enough time is allowed for this transfer of heat to run its course, the temperature a thermometer registers does represent the system with which it is in thermal equilibrium. Thermal equilibrium is established when two bodies are in contact with each other and can freely exchange energy.

Practice Key Terms 9

Get Jobilize Job Search Mobile App in your pocket Now!

Get it on Google Play Download on the App Store Now


Source:  OpenStax, Concepts of physics. OpenStax CNX. Aug 25, 2015 Download for free at https://legacy.cnx.org/content/col11738/1.5
Google Play and the Google Play logo are trademarks of Google Inc.

Notification Switch

Would you like to follow the 'Concepts of physics' conversation and receive update notifications?

Ask