<< Chapter < Page Chapter >> Page >
An example exam taken by two different schools with different variability. School A's spread, or standard deviation, is much lower than school B's.
Fourth grade math scores in two different schools with the same mean but different variability

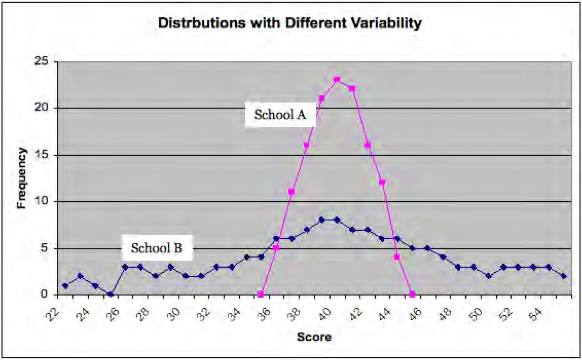
However, the range is only based on two scores in the distribution, the highest and lowest scores, and so does not represent variability in all the scores. The standard deviation is based on how much, on average, all the scores deviate from the mean. In the example in [link] the standard deviations are 7.73 for School A and 2.01 for School B. In the exercise below we demonstrate how to calculate the standard deviation.

Calculating a standard deviation

Example: The scores from 11 students on a quiz are 4, 7, 6, 3, 10, 7, 3, 7, 5, 5, and 9

  1. Order scores.
  2. Calculate the mean score.
  3. Calculate the deviations from the mean.
  4. Square the deviations from the mean.
  5. Calculate the mean of the squared deviations from the mean (i.e. sum the squared deviations from the mean then divide by the number of scores). This number is called the variance.
  6. Take the square root and you have calculated the standard deviation.
Calculating a standard deviation
Score(Step 1, order) Deviation from the mean Squared deviation from the mean
3 -3 9
3 -3 9
4 -2 4 (Step 4-5, complete the calculations)
5 -1 1 Formula:
5 -1 1 Standard deviation = ( Score Mean ) 2 N
N = Number of scores
6 0 0
7 1 1
7 1 1
7 1 1
9 3 9
10 4 4
TOTAL = 66 52
(Step 2, calculate mean) (Step 3, calculate deviations) (Step 6, find the standard deviation)

The normal distribution

Knowing the standard deviation is particularly important when the distribution of the scores falls on a normal distribution. When a standardized test is administered to a very large number of students the distribution of scores is typically similar, with many students scoring close to the mean, and fewer scoring much higher or lower than the mean. When the distribution of scores looks like the bell shape shown in [link] it is called a normal distribution. In the diagram we did not draw in the scores of individual students as we did in [link] , because distributions typically only fall on a normal curve when there are a large number of students; too many to show individually. A normal distribution is symmetric, and the mean, median and mode are all the same.

Bell shaped curve of normal distribution

A bell-shaped normal distribution of scores.

Normal curve distributions are very important in education and psychology because of the relationship between the mean, standard deviation, and percentiles. In all normal distributions 34 per cent of the scores fall between the mean and one standard deviation of the mean. Intelligence tests often are constructed to have a mean of 100 and standard deviation of 15 and we illustrate that in [link] .

A bell-shaped normal distribution of scores, showing the standard deviations.
Normal distribution for an IQ test with mean 100 and standard deviation 15

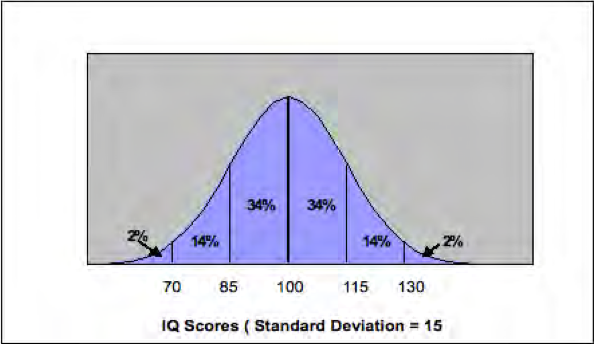
In this example, 34 per cent of the scores are between 100 and 115 and as well, 34 per cent of the scores lie between 85 and 100. This means that 68 per cent of the scores are between -1 and +1 standard deviations of the mean (i.e. 85 and 115). Note than only 14 per cent of the scores are between +1 and +2 standard deviations of the mean and only 2 per cent fall above +2 standard deviations of the mean.

Questions & Answers

it is the relatively stable flow of income
Chidubem Reply
what is circular flow of income
Divine Reply
branches of macroeconomics
SHEDRACK Reply
what is Flexible exchang rate?
poudel Reply
is gdp a reliable measurement of wealth
Atega Reply
introduction to econometrics
Husseini Reply
Hi
mostafa
hi
LEMLEM
hello
Sammol
hi
Mahesh
bi
Ruqayat
hi
Ruqayat
Hi fellas
Nyawa
hey
Sammol
hi
God
hello
Jahara
Good morning
Jorge
hi
abubakar
hi
Nmesoma
hi
Mahesh
Hi
Tom
Why is unemployment rate never zero at full employment?
Priyanka Reply
bcoz of existence of frictional unemployment in our economy.
Umashankar
what is flexible exchang rate?
poudel
due to existence of the pple with disabilities
Abdulraufu
the demand of a good rises, causing the demand for another good to fall
Rushawn Reply
is it possible to leave every good at the same level
Joseph
I don't think so. because check it, if the demand for chicken increases, people will no longer consume fish like they used to causing a fall in the demand for fish
Anuolu
is not really possible to let the value of a goods to be same at the same time.....
Salome
Suppose the inflation rate is 6%, does it mean that all the goods you purchase will cost 6% more than previous year? Provide with reasoning.
Geetha Reply
Not necessarily. To measure the inflation rate economists normally use an averaged price index of a basket of certain goods. So if you purchase goods included in the basket, you will notice that you pay 6% more, otherwise not necessarily.
Waeth
discus major problems of macroeconomics
Alii Reply
what is the problem of macroeconomics
Yoal
Economic growth Stable prices and low unemployment
Ephraim
explain inflationcause and itis degre
Miresa Reply
what is inflation
Getu
increase in general price levels
WEETO
Good day How do I calculate this question: C= 100+5yd G= 2000 T= 2000 I(planned)=200. Suppose the actual output is 3000. What is the level of planned expenditures at this level of output?
Chisomo Reply
how to calculate actual output?
Chisomo
how to calculate the equilibrium income
Beshir
Criteria for determining money supply
Thapase Reply
who we can define macroeconomics in one line
Muhammad
Aggregate demand
Mohammed
C=k100 +9y and i=k50.calculate the equilibrium level of output
Mercy Reply
Hi
Isiaka
Hi
Geli
hy
Man
👋
Bahunda
hy how are you?
Man
ys
Amisha
how are you guys
Sekou
f9 guys
Amisha
how are you guys
Sekou
ys am also fine
Amisha
fine and you guys
Geli
from Nepal
Amisha
nawalparasi district from belatari
Amisha
nd u
Amisha
I am Camara from Guinea west Africa... happy to meet you guys here
Sekou
ma management ho
Amisha
ahile becheclor ho
Amisha
hjr ktm bta ho ani k kaam grnu hunxa tw
Amisha
belatari
Amisha
1st year ho
Amisha
nd u
Amisha
ahh
Amisha
kaha biratnagar
Amisha
ys
Amisha
kina k vo
Amisha
money as unit of account means what?
Kalombe
A unit of account is something that can be used to value goods and services and make calculations
Jim
all of you please speak in English I can't understand you're language
Muhammad
I want to know how can we define macroeconomics in one line
Muhammad
it must be .9 or 0.9 no Mpc is greater than 1 Y=100+.9Y+50 Y-.9Y=150 0.1Y/0.1=150/0.1 Y=1500
Kalombe
Mercy is it clear?😋
Kalombe
hi can someone help me on this question If a negative shocks shifts the IS curve to the left, what type of policy do you suggest so as to stabilize the level of output? discuss your answer using appropriate graph.
Galge Reply
if interest rate is increased this will will reduce the level of income shifting the curve to the left ◀️
Kalombe
Got questions? Join the online conversation and get instant answers!
Jobilize.com Reply

Get Jobilize Job Search Mobile App in your pocket Now!

Get it on Google Play Download on the App Store Now


Source:  OpenStax, Educational psychology. OpenStax CNX. May 11, 2011 Download for free at http://cnx.org/content/col11302/1.2
Google Play and the Google Play logo are trademarks of Google Inc.

Notification Switch

Would you like to follow the 'Educational psychology' conversation and receive update notifications?

Ask