

| << Chapter < Page | Chapter >> Page > |
is said to be in general form .
We must stipulate that and cannot both equal zero at the same time, for if they were we would have
This statement is true only if . If were to be any other number, we would get a false statement.
Now, we have the following:
The graphing of all ordered pairs that solve a linear equation in two variables produces a straight line.
This implies,
The graph of a linear equation in two variables is a straight line.
From these statements we can conclude,
If an ordered pair is a solution to a linear equations in two variables, then it lies on the graph of the equation.
Also,
Any point (ordered pairs) that lies on the graph of a linear equation in two variables is a solution to that equation.
When we want to graph a linear equation, it is certainly impractical to graph infinitely many points. Since a straight line is determined by only two points, we need only find two solutions to the equation (although a third point is helpful as a check).
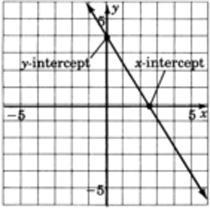
Graph the following equations using the intercept method.
To find the , let and .
Thus, we have the point . So, if , .
To find the , let and .
Thus, we have the point . So, if , .
Construct a coordinate system, plot these two points, and draw a line through them. Keep in mind that every point on this line is a solution to the equation .

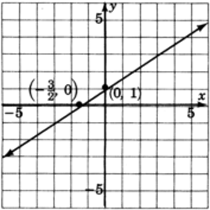
To find the , let and .
Thus, we have the point . So, if , .
To find the , let and .
Thus, we have the point . So, if , .
Construct a coordinate system, plot these two points, and draw a line through them. Keep in mind that all the solutions to the equation are precisely on this line.
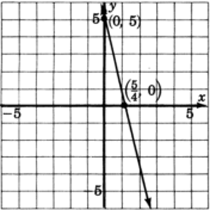
To find the , let and .
Thus, we have the point . So, if , .
To find the , let and .
Thus, we have the point . So, if , .
Construct a coordinate system, plot these two points, and draw a line through them.
Notification Switch
Would you like to follow the 'Elementary algebra' conversation and receive update notifications?

|
|
|
|
|

|
|

|
|

|
|

|
|

|
|

|
|

|
|

|
|

|
|
|
|