

| << Chapter < Page | Chapter >> Page > |
Use
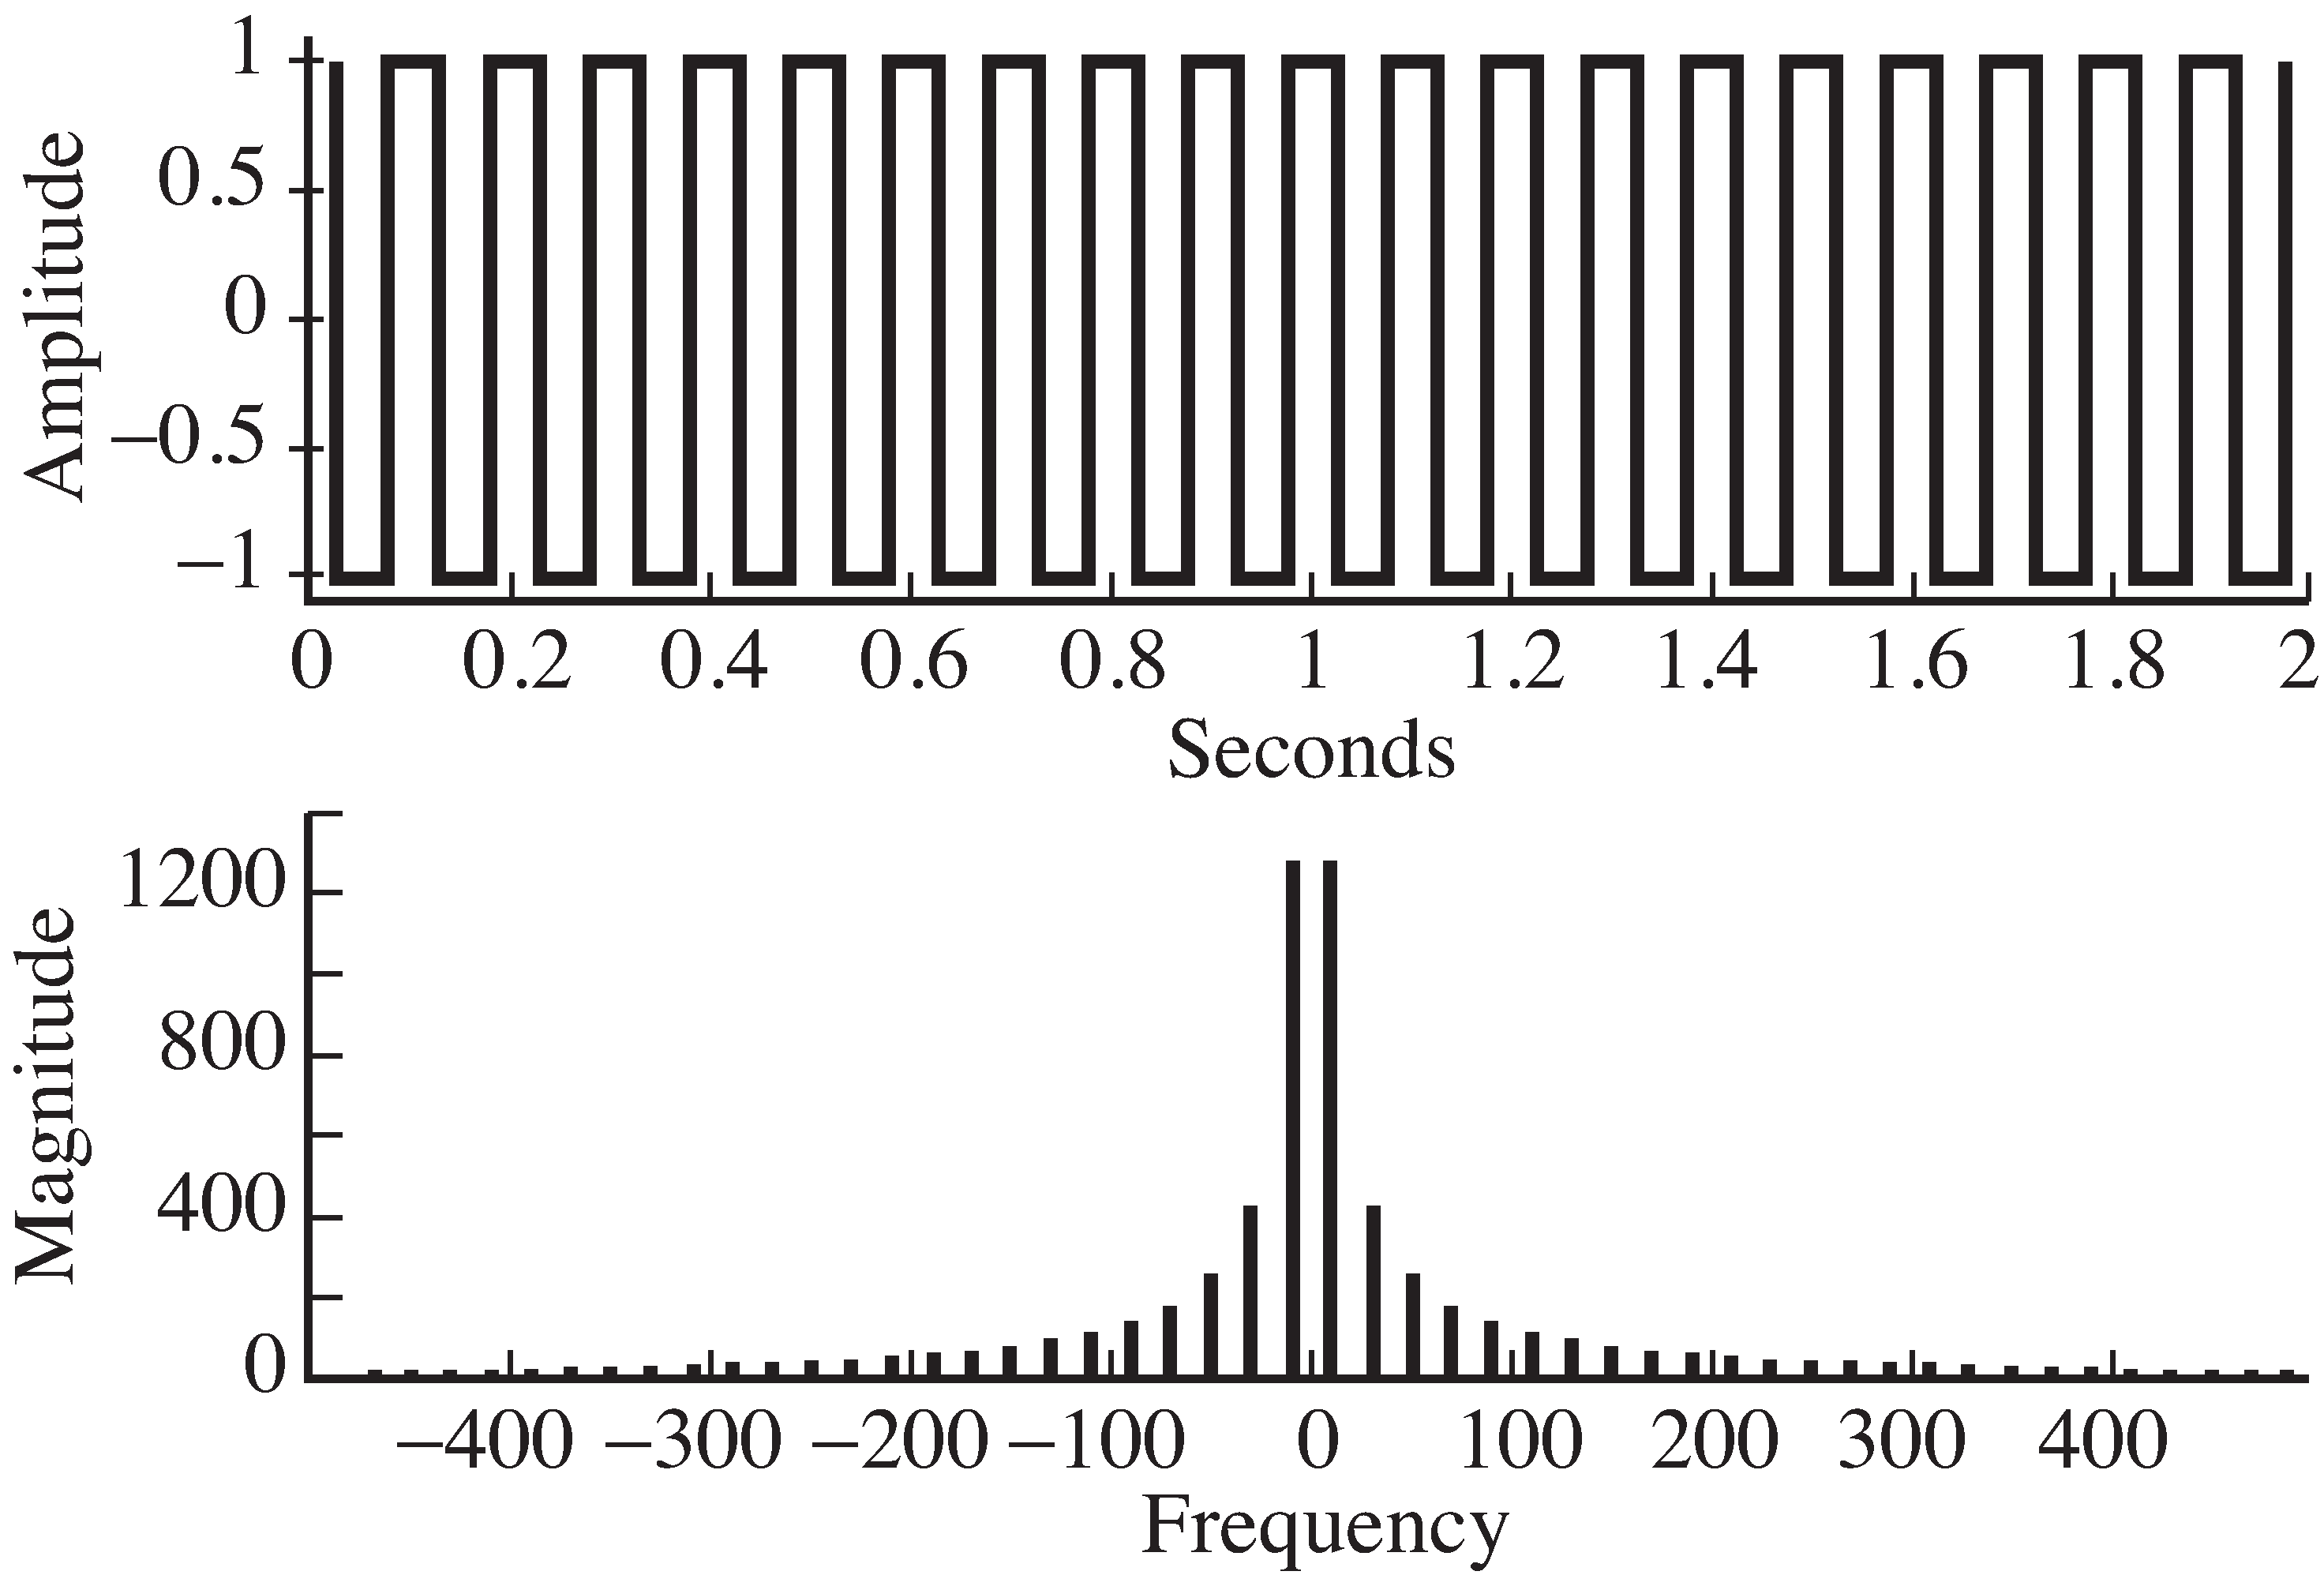
specsquare.m to investigate the relationship between
the time behavior of the square wave and its spectrum.The M
atlab command
zoom on is often helpful
for viewing details of the plots.
f=20, 40, 100,
300
Hz. How do the time plots change? How do the spectra change?time=1, 10, 100 seconds. How does the spectrum change in each case?Ts=1/100, 1/10000 .
seconds. How does the spectrum change in each case?In your
Signals and Systems course, you probably calculated
(analytically) the spectrum of a square wave by using the Fourier series.How does this calculation compare with the discrete data version
found by
specsquare.m ?
Mimic the code in
specsquare.m to find the spectrum of
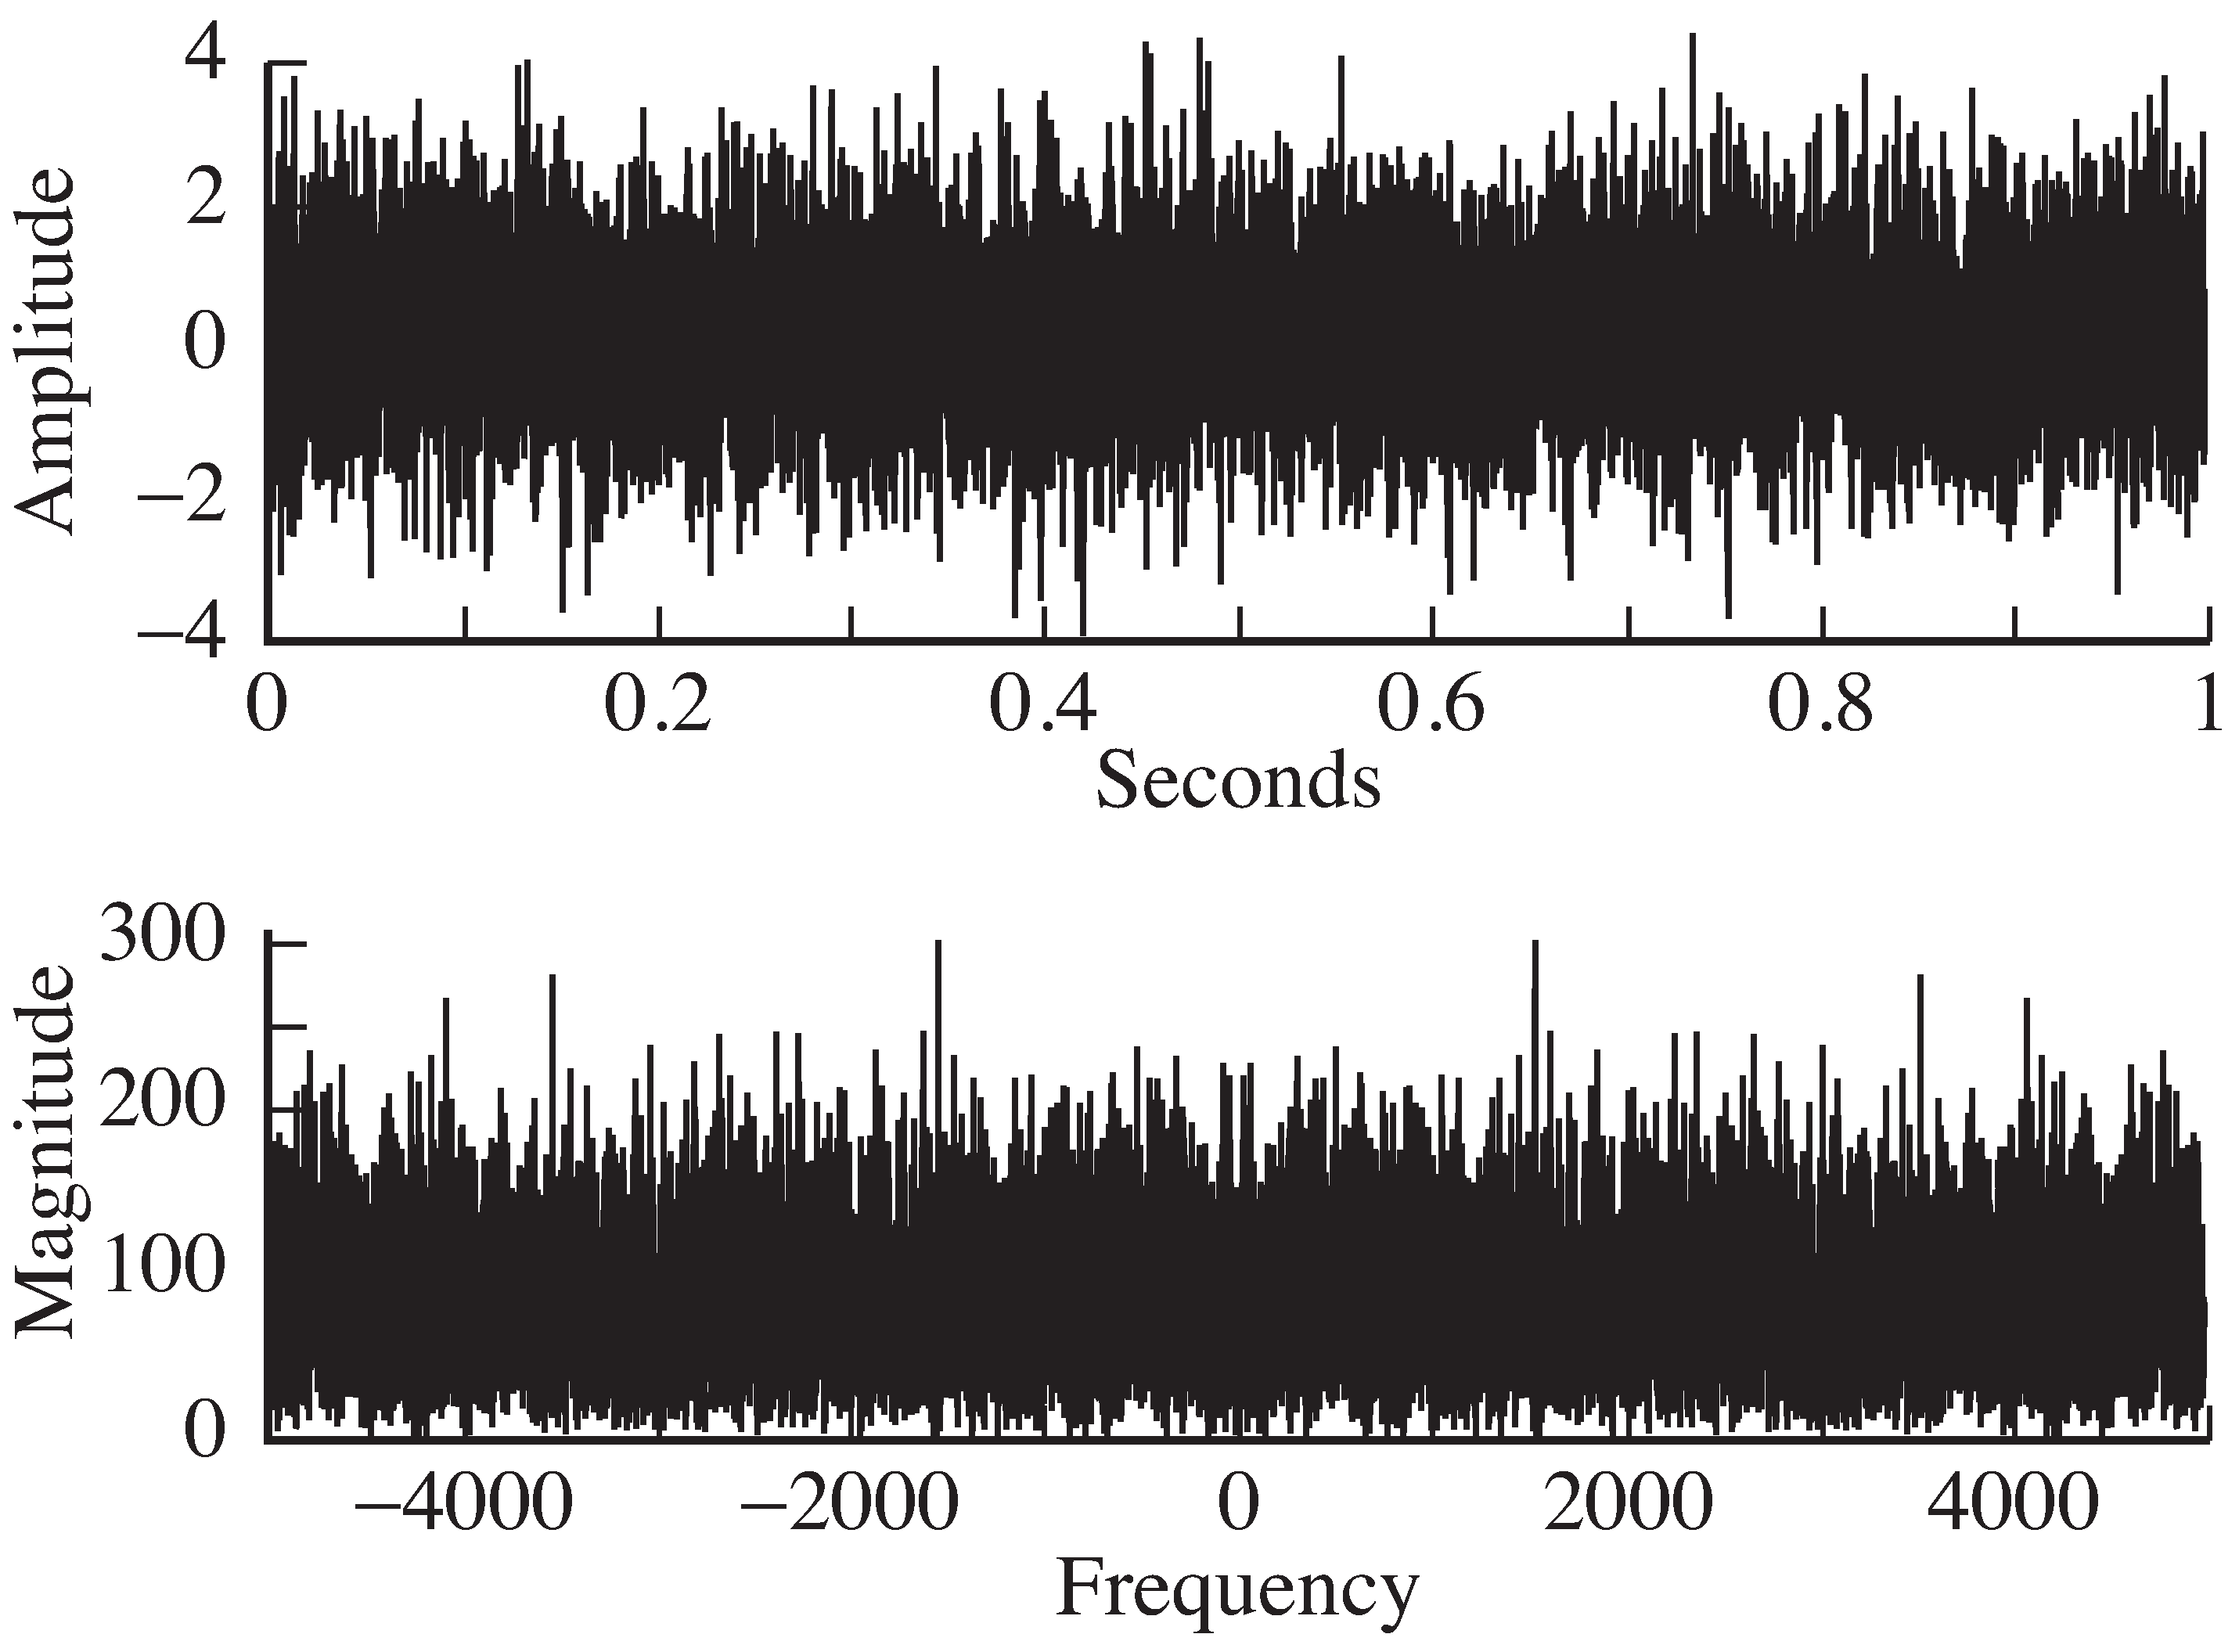
M atlab has several commands that create random numbers:
rand to create a signal that is uniformly
distributed on
. Find the spectrum of
the signal by mimicking the code in
specnoise.m .rand and the
sign function to create
a signal that is
with probability
and
with probability
. Find the spectrum of the signal.randn to create a signal that is normally distributed
with mean 0 and variance 3. Find the spectrum of the signal.Modify the code in
plotspec.m to also plot the phase
spectrum.
While
plotspec.m can be quite useful, ultimately,
it will be necessary to have more flexibility,which, in turn, requires one to understand how the
FFT function inside
plotspec.m works. This will be discussed
at length in
[link] .
The next six sections describe the six elementsthat are at the heart of communications systems. The elements
are described in both the time domain and in thefrequency domain.
The Latin word oscillare means “to ride in a swing.” It is the origin of oscillate , which means to move back and forth in steady unvarying rhythm.Thus, a device that creates a signal that moves back and forth in a steady, unvarying rhythm is calledan oscillator . An electronic oscillator is a device thatproduces a repetitive electronic signal, usually a sinusoidal wave.
A basic oscillator is diagrammed in [link] . Oscillators are typically designed to operate at a specified frequency , and the input specifies the phase of the output
The input may be a fixed number, but it may also be a signal; that is, it may change over time.In this case, the output is no longer a pure sinusoid of frequency . For instance, suppose the phase is a “ramp” or line with slope ; that is, . Then , and the “actual” frequency of oscillation is .
Notification Switch
Would you like to follow the 'Software receiver design' conversation and receive update notifications?

|
|

|
|

|
|
|
|
|

|
|
|
|
|

|
|

|
|

|
|

|