

| << Chapter < Page | Chapter >> Page > |
Quantization of an input is another kind of common nonlinearity.
The M
atlab function
quantalph.m (available on the website)
quantizes a signal to the nearest element of adesired set. Its help file reads
% y=quantalph(x,alphabet)
%% quantize the input signal x to the alphabet
% using nearest neighbor method% input x - vector to be quantized
% alphabet - vector of discrete values%            that y can assume
%            sorted in ascending order% output y - quantized vector
time=.5; Ts=1/10000;                    % total time and sampling interval
t=Ts:Ts:time;                           % define a "time" vectorfc=1000; cmod=cos(2*pi*fc*t);           % create cos of freq fc
fi=100; x=cos(2*pi*fi*t);               % input is cos of freq fiy=cmod.*x;                              % multiply input by cmod
figure(1), plotspec(cmod,Ts)            % find spectra and plotfigure(2), plotspec(x,Ts)
figure(3), plotspec(y,Ts)

modulate.m  change the frequency of the input
(download file)
Let
x be a random vector
x=randn(1,n) of length
n .
Quantize
x to the nearest
.
x and the
magnitude spectrum of the output.x=3*randn(1,n) and answer the
same questions.One feature of most telecommunications systems is the ability to change the frequency of the signal without changing itsinformation content. For example, speech occurs in the range below about 8K Hz. In order to transmit this, it is upconverted(as in [link] ) to radio frequencies where the energy can easily propagateover long distances. At the receiver, it is downconverted (as in [link] ) to the original frequencies. Thus the spectrum is shifted twice.
One way of accomplishing this kind of frequency shifting is to multiply the signal by a cosine wave, as shown in [link] . The following M atlab code implements a simple modulation.
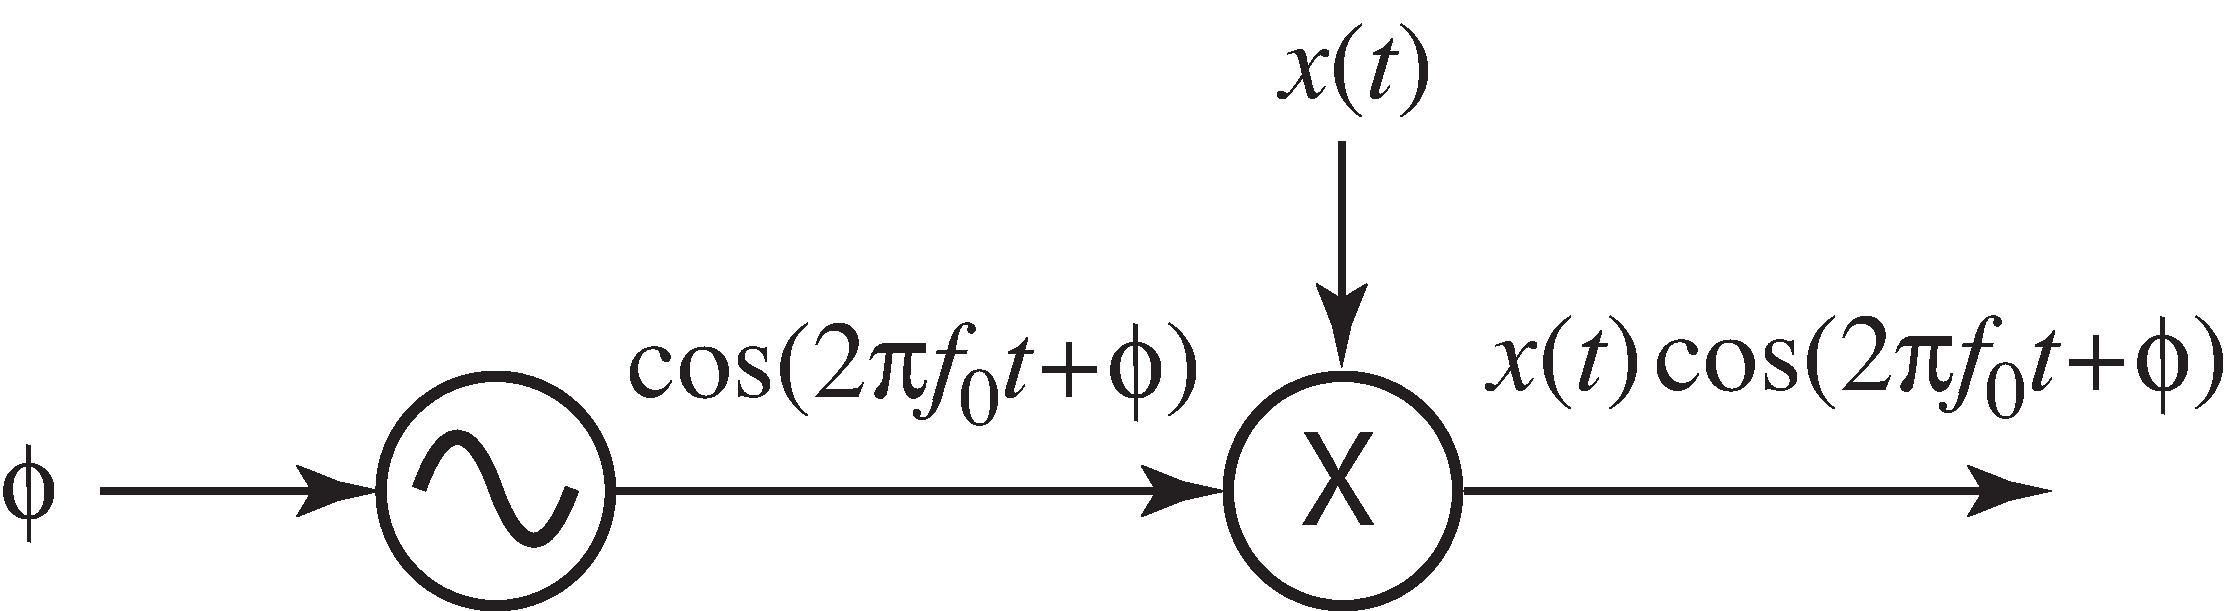
The first three lines of the code create the modulating sinusoid
(i.e., an oscillator). The next line specifies the input(in this case another cosine wave). The M
atlab syntax
.* calculates a point-by-point multiplication of
the two vectors
cmod and
x .
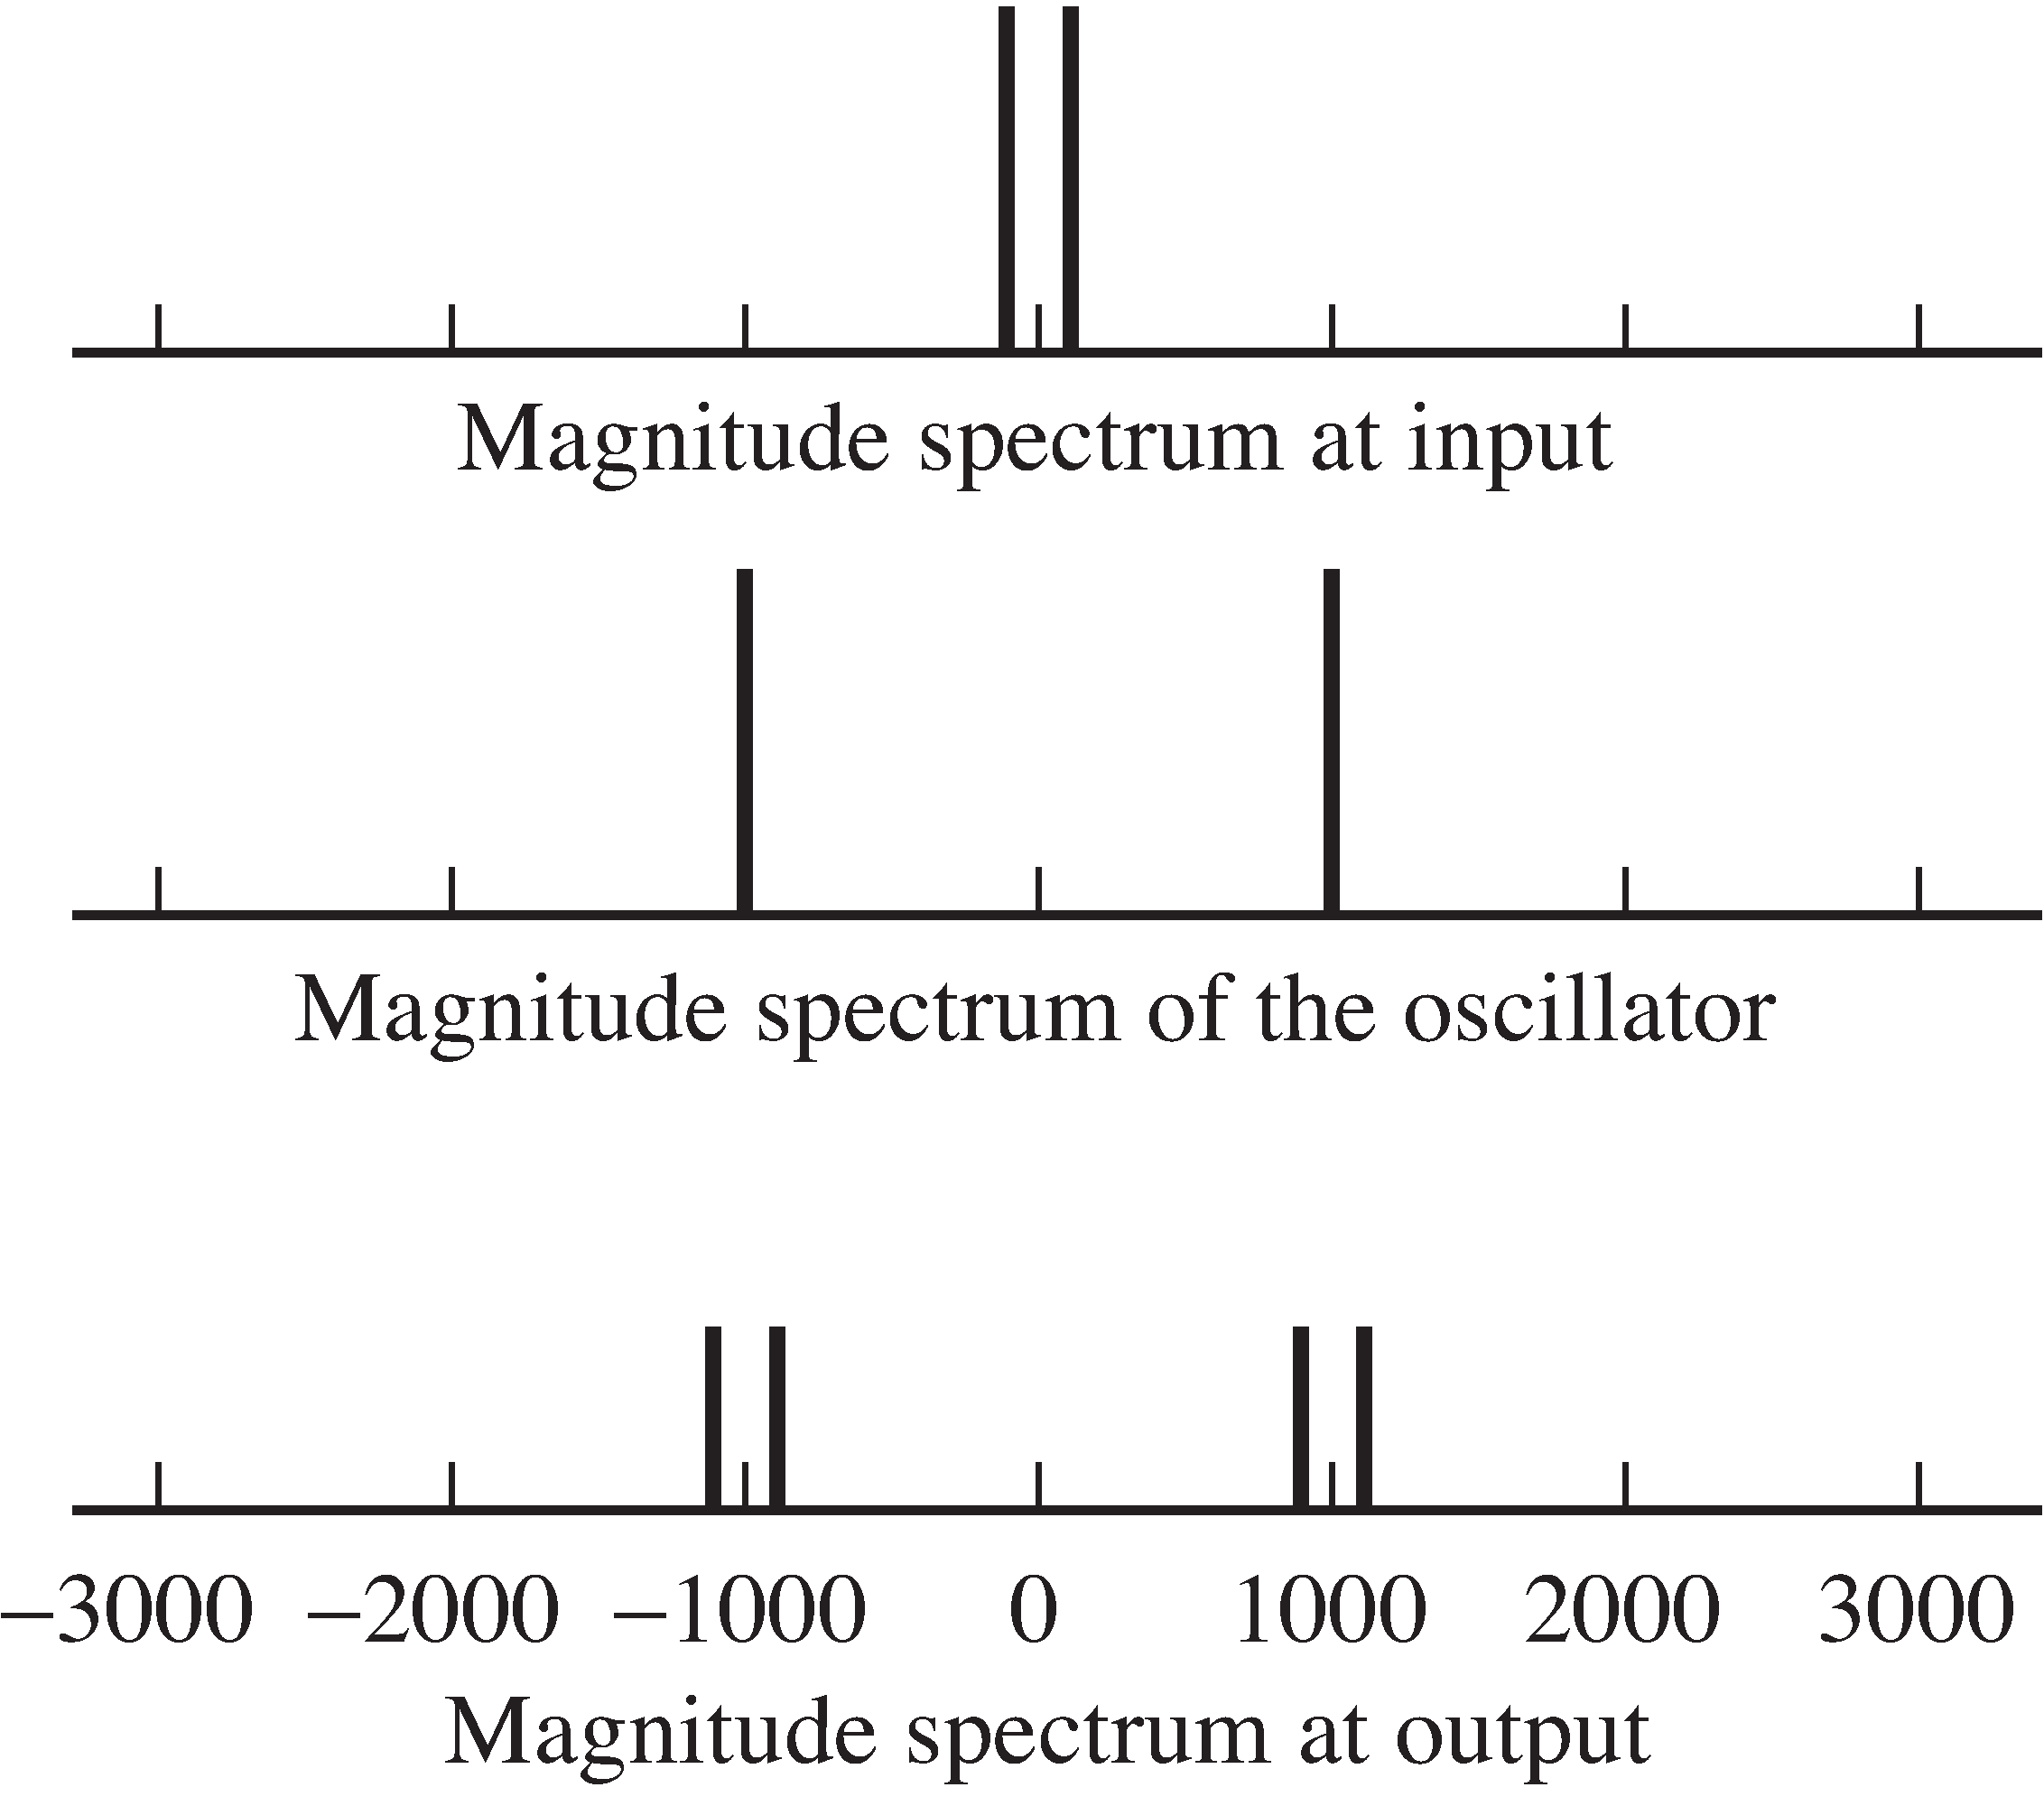
The output of
modulate.m is shown in
[link] .
The spectrum of the input contains spikes representingthe input sinusoid at
Hz and
the spectrum of the modulating sinusoid contains spikes at
Hz.
As expected from the modulation property of the transform,
the output contains sinusoids at
Hz,
which appear in the spectrum as the two pairs of spikesat
and
Hz.
Of course, this modulation can be applied to any signal, not justto an input sinusoid. In all cases, the output will contain two copies
of the input, one shifted up in frequency and the other shifted downin frequency.
Mimic the code in
modulate.m to find the
spectrum of the output
of a modulator block
(with modulation frequency
Hz) when
Notification Switch
Would you like to follow the 'Software receiver design' conversation and receive update notifications?

|
|

|
|

|
|

|
|

|
|

|
|

|
|

|
|

|
|

|