

| << Chapter < Page | Chapter >> Page > |
Recall the figure below, from the module Discrete-Time Implementation of Digital Communication . When the channel is trivial and noiseless and thepulses satisfy the Nyquist criterion (i.e., ), the digital comm system will work perfectly, yielding .
![This flowchart shows movement from a[m] to a box containing an up arrow and the variable P, then with an arrow labeled a-up-arrow[k] shows movement to the right to a box labeled g[k]. To the right of this is an arrow labeled m-tilde[k] that points to the right at a box labeled h-tilde[k]. To the right of this is an arrow that points to the right at a plus-circle. Above the plus-circle is the expression w-tilde[k], which points down at the circle. To the right of the plus-circle is an arrow labeled v-tilde[k] that points to the right at a box labeled q[k]. To the right of this is an arrow labeled y-up-arrow[k] that points to the right at a box containing a down arrow and the variable P. To the right of this is an arrow that points to the right at a final expression, y[n].](/ocw/mirror/col10968_1.2_complete/m31814/fig69.png)
In practice, however,
leading to , in which case we must infer the value of from the received samples . For now, we consider using only the single sample to infer .
Key question: What are the mechanisms by which errors are made?
To better understand error behavior, we can plot the “eye diagram” or the “constellation diagram” and calculate the symbol error rate (SER).
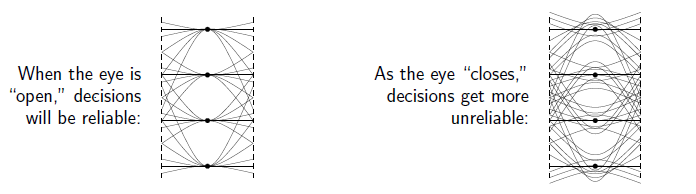
Usually used when , the eye diagram is a plot which superimposes T -second segments of over the time intervals for many integers n .
![This graph shows a series of waves on a graph of t and Re[y(t)], and specific points of these waves are drawn to correspond to a prism-like graph of width T called eye diagram.](/ocw/mirror/col10968_1.2_complete/m31814/fig70.png)
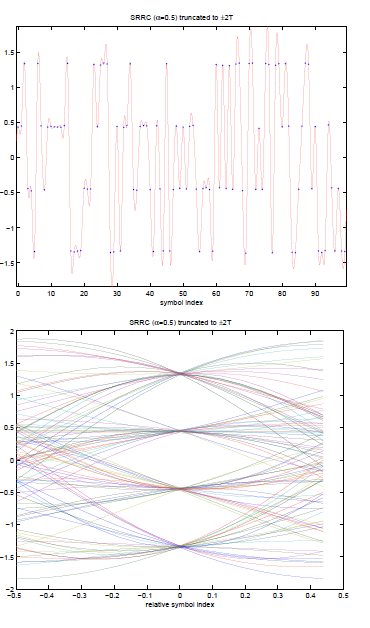
In MATLAB, the eye diagram can be made by superimposing P -sample segments of corresponding to intervals for many n . (Usually .)
If , eye diagrams can be plotted for both the “I” and “Q” channels using and , respectively.MATLAB for digital mod/demod with eye diagram:
"% design SRRC
P = 16; % oversampling factoralpha = 0.5; % SRRC rolloff param
D = 2; % truncation to [-DT,DT]g = srrc(D,alpha,P); % SRRC pulse
Ng = length(g);% generate symbols
N = 100; % # symbolsM = 4; % alphabet size
sig2a = 1; % symbol variancea = pam(N,M,sig2a); % symbol sequence
% pulse-amplitude modulatea_up = zeros(1,N*P);
a_up(1:P:end) = a; % upsampled symbolsm = conv(a_up,g); % PAM
% matched-filter demodulatey_up = conv(m,g); % use SRRC again
% remove causal filtering delayleft = -P/2; % left edge of eye diagram
k = left+[1:P*N]; % desired time indices
dly = (Ng-1)/2+(Ng-1)/2;% delay due to pulsesy_up = y_up(k+dly); % remove delay
y = y_up([1-left:P:P*N]);% downsample
% plot received signalfigure(1)
plot(left/P+[0:P*N-1]/P,y_up,’r’,[0:N-1],y,’.’);axis(‘tight’)
title([‘SRRC (\alpha=‘,num2str(alpha),...‘) truncated to \pm’,num2str(D),’T’])xlabel([‘symbol index’])% plot eye diagram
figure(2)Y_up = reshape(y_up,P,N); % extract segments
plot(left/P+[0:P-1]/P,Y_up) % superimpose them
title([‘SRRC (\alpha=‘,num2str(alpha),...‘) truncated to \pm’,num2str(D),’T’])xlabel([‘relative symbol index’])
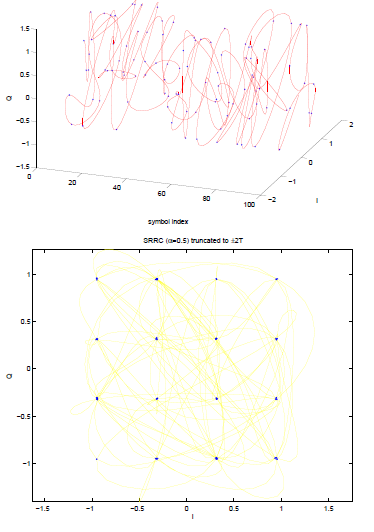
The constellation diagram is a plot of vs. for many integers n . When the comm system is working well, the points cluster around thesymbol alphabet values:
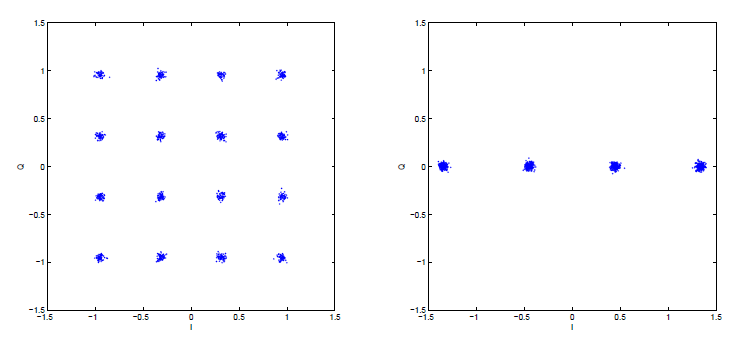
Recall that due to the complex-baseband channel model, regardless of whether or .
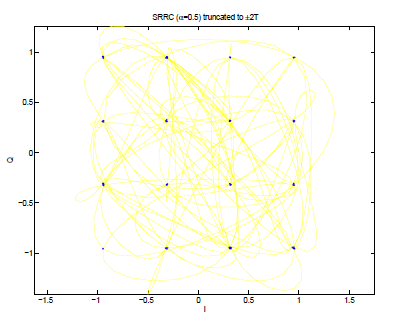
Sometimes it is instructive to superimpose a plot of vs. , which approximates the trajectory of in the complex plane:
MATLAB for digital mod/demod with constellation diagram:
% design SRRC
P = 8; % oversampling factoralpha = 0.5; % SRRC rolloff param
D = 2; % truncation to [-DT,DT]g = srrc(D,alpha,P); % SRRC pulse
Ng = length(g);% generate symbols
N = 100; % # symbolsM = 4; % (sqrt) alphabet size
sig2a = 1; % symbol variancea = qam(N,M,sig2a); % symbol sequence
% pulse-amplitude modulatea_up = zeros(1,N*P);
a_up(1:P:end) = a; % upsampled symbolsm = conv(a_up,g); % PAM
% matched-filter demodulatey_up = conv(m,g); % use SRRC again
% remove causal filtering delayk = [1:P*N]; % desired time indicesdly = (Ng-1)/2+(Ng-1)/2;% delay due to pulses
y_up = y_up(k+dly); % remove delayy = y_up(1:P:end); % downsample
% plot received signalfigure(1)
plot3([0:P*N-1]/P,real(y_up),imag(y_up),...
‘r’,[0:N-1],real(y),imag(y),’.’);
xlabel(‘symbol index’);ylabel(‘I’); zlabel(‘Q’);
view(20,30); % to see full trajectory%also try view(0,90), view(0,0), view(90,0)
% plot constellation diagramfigure(2)
plot(real(y_up),imag(y_up),’y’,real(y),imag(y),’.’);xlabel(‘I’); ylabel(‘Q’);
title([‘SRRC (\alpha=‘,num2str(alpha),...‘) truncated to \pm’,num2str(D),’T’])axis(‘equal’);
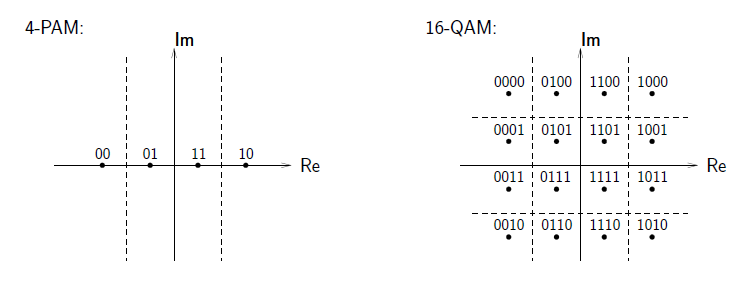
QAM : “quadrature amplitude modulation”
PAM : “pulse amplitude modulation”
PSK : "phase shift keying"
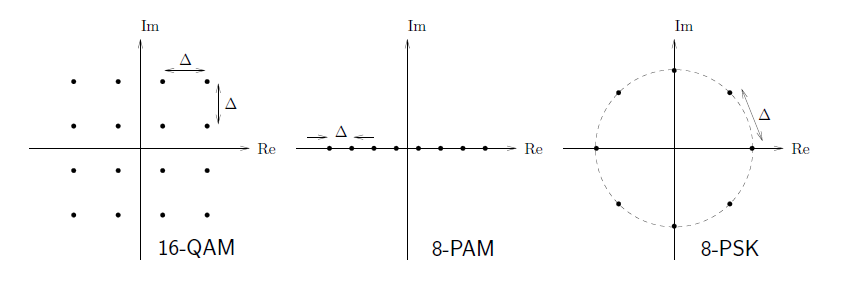
Note that: "QPSK" = 4-QAM = 4-PSK and "BPSK" = 2-PAM = 2-PSK
When the alphabet entries are spaced by Δ and picked with equal probability, the symbol variance obeys:
| alphabet | M 2 -QAM | M -PAM | M -PSK |
| σ a 2 |
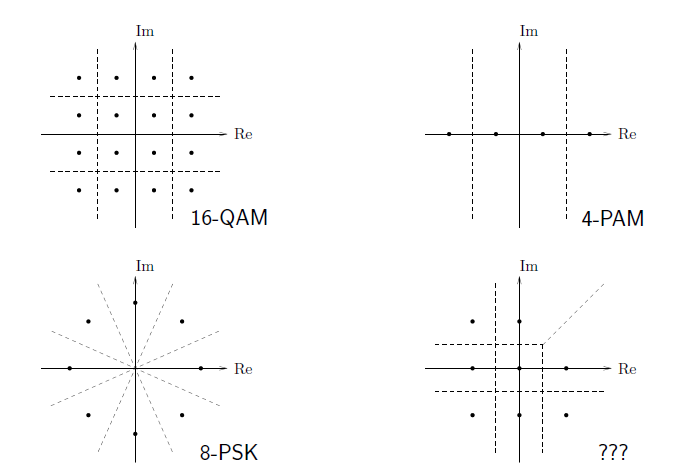
A reasonable way to infer the transmitted symbol from the received sample is to decide that was the alphabet element nearest to .
Nearest-element decision making is equivalent to using decision regions whose boundaries are equidistant from the two nearest alphabet elements:
When , the symbol error rate (SER) equals the probability that lies outside the decision region corresponding to alphabet member a . Writing , we represent the cumulative effect of noise and ISI by the error . Usually we model as a Gaussian random variable with mean 0 and variance σ e 2 .
Let's first consider an M -PAM alphabet, where . Since the decision regions show that is not useful, we'll consider only the real parts of and .
When , we have , implying that is Gaussian with mean a and variance σ e 2 , abbreviated as “ ”. This is illustrated below for the case of 4-PAM:
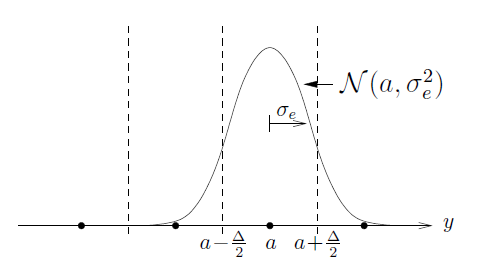
Formally, we say that , the probability density function (pdf) of conditioned on , obeys
Basically, tells us how likely it is that given that .
Consider first the case where a is an “interior” (not an “edge”) element of the symbol alphabet.Given that , we make an error when or when . To find the probability of the latter error event, i.e.,
we integrate over :
The integral represents the shaded area below:
![This figure is the same bell curve as in the previous figure, except that the area to the right of the rightmost vertical dashed line is shaded yellow, and the bell curve itself is labeled p_y[n]a[n](y|a).](/ocw/mirror/col10968_1.2_complete/m31814/fig79.png)
This integral is often solved via
using the “Q function”:
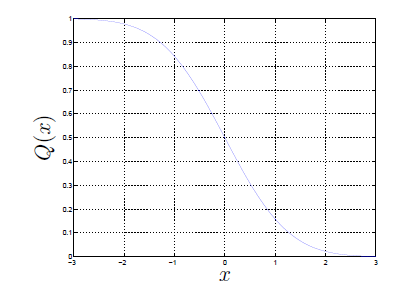
While the Q function is not represented in MATLAB, it can be calculated using the “complementary error function” :
In any case, the latter error event occurs with probability
By symmetry, the former error event probability is also
Since these two events are disjoint, the probability of making a decision error on an interior symbol equals their sum:
For edge symbols, we experience half the decision error probability, since there is only one decision boundary to cross.
Finally, we average over the conditional error probabilities:
Using , we can finally write
With QAM, we have complex-valued , , . We'll assume that and are uncorrelated and equal variance.To calculate SER, we can re-use the PAM approach with a few modifications:
![This figure contains two graphs. The first plots Re against Im, and is titled Pr[error|a[n] = a]. It displays an array of sixteen evenly-spaced dots and a grid of dashed lines around the dots. The square containing the dot in the second row and the third column of the grid is labeled a, and is the only portion of the graph not shaded yellow. Conversely, the second graph has the same grid, same array, but this second row, third column dot is the only shaded box of the graph. The second graph is titled Pr[correct|a[n] = a].](/ocw/mirror/col10968_1.2_complete/m31814/fig81.png)
After a bit of algebra, we find
With an M -ary alphabet, there are bits per symbol, so 1 symbol error could cause up to bit errors.
Gray coding is a clever way of mapping bits to symbols so that neighboring symbols differ by only a single bit.Since the vast majority of errors occur when falls into a neighboring decision region, Gray coding yields BER SER.
Notification Switch
Would you like to follow the 'Introduction to analog and digital communications' conversation and receive update notifications?

|
|

|
|

|
|

|
|

|
|

|
|

|
|

|
|

|
|
|
|