Is the
-axis and asymptote or and axis of symmetry to both graphs ? Explain your answer.
Which graph is represented by the equation
? Explain your answer.
Solve the equation
graphically and check that your answer is correct by using substitution.
Predict how the graph
will compare to
and then draw the graph of
on the same set of axes.
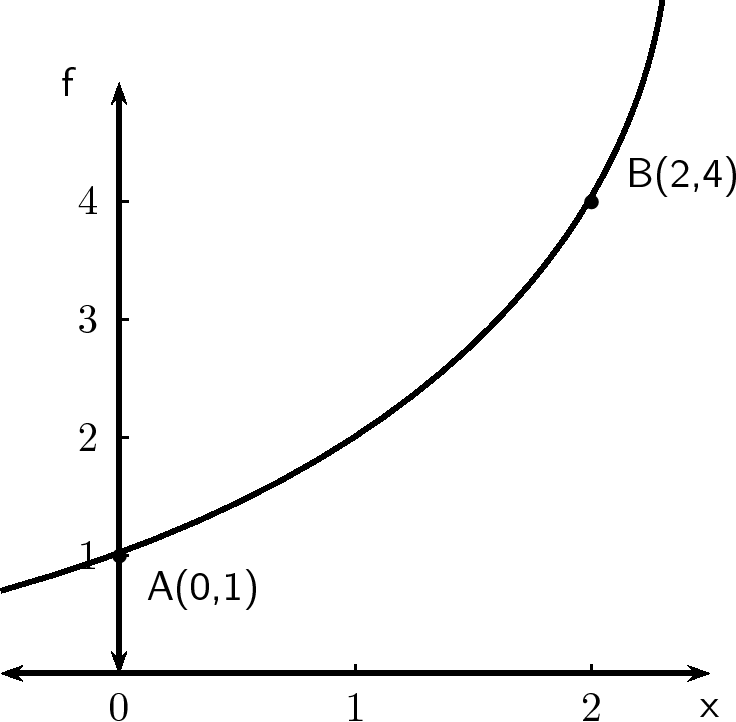
The curve of the exponential function
in the accompanying diagram cuts the y-axis at the point A(0; 1) and B(2; 4) is on
.
Determine the equation of the function
.
Determine the equation of
, the function of which the curve is the reflection of the curve of
in the
-axis.
Determine the range of
.
Summary
You should know the following charecteristics of functions:
The given or chosen x-value is known as the independent variable, because its value can be chosen freely. The calculated y-value is known as the dependent variable, because its value depends on the chosen x-value.
The domain of a relation is the set of all the x values for which there exists at least one y value according to that relation. The range is the set of all the y values, which can be obtained using at least one x value.
The intercept is the point at which a graph intersects an axis. The x-intercepts are the points at which the graph cuts the x-axis and the y-intercepts are the points at which the graph cuts the y-axis.
Only for graphs of functions whose highest power is more than 1. There are two types of turning points: a minimal turning point and a maximal turning point. A minimal turning point is a point on the graph where the graph stops decreasing in value and starts increasing in value and a maximal turning point is a point on the graph where the graph stops increasing in value and starts decreasing.
An asymptote is a straight or curved line, which the graph of a function will approach, but never touch.
A line about which the graph is symmetric
The interval on which a graph increases or decreases
A graph is said to be continuous if there are no breaks in the graph.
Set notation
A set of certain x values has the following form: {x : conditions, more conditions}
Interval notation
Here we write an interval in the form ’lower bracket, lower number, comma, upper number, upper bracket’
You should know the following functions and their properties:
Functions of the form
. These are straight lines.
Functions of the Form
These are known as parabolic functions or parabolas.
Functions of the Form
. These are known as hyperbolic functions.
Functions of the Form
. These are known as exponential functions.
End of chapter exercises
Sketch the following straight lines:
Sketch the following functions:
Sketch the following functions and identify the asymptotes:
Sketch the following functions and identify the asymptotes:
Determine whether the following statements are true or false. If the statement is false, give reasons why:
The given or chosen y-value is known as the independent variable.
An intercept is the point at which a graph intersects itself.
There are two types of turning points – minimal and maximal.
A graph is said to be congruent if there are no breaks in the graph.
Functions of the form
are straight lines.
Functions of the form
are exponential functions.
An asymptote is a straight or curved line which a graph will intersect once.
Given a function of the form
, to find the y-intersect put
and solve for
.
The graph of a straight line always has a turning point.
Given the functions
and
Draw
and
on the same set of axes.
Calculate the points of intersection of
and
.
Hence use your graphs and the points of intersection to solve for
when:
Give the equation of the reflection of
in the
-axis.
After a ball is dropped, the rebound height of each bounce decreases. The equation
shows the relationship between
, the number of bounces, and
, the height of the bounce, for a certain ball. What is the approximate height of the fifth bounce of this ball to the nearest tenth of a unit ?
Mark had 15 coins in five Rand and two Rand pieces. He had 3 more R2-coins than R5-coins. He wrote a system of equations to represent this situation, letting
represent the number of five rand coins and
represent the number of two rand coins. Then he solved the system by graphing.