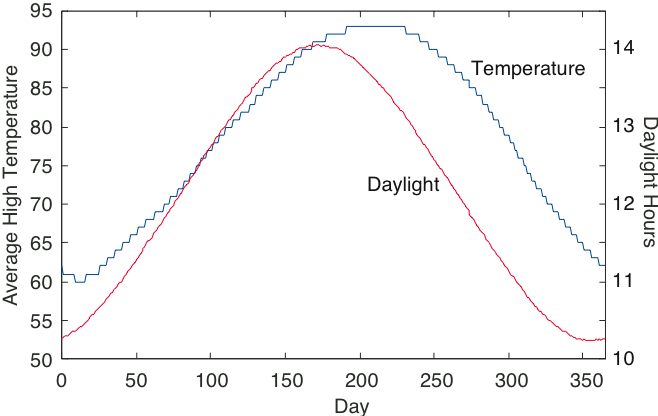
In this problem, we want to understand the temperature
component of our environment using Fourier series andlinear system theory. The file
temperature.mat contains these data
(daylight hours in the first row, corresponding averagedaily highs in the second) for Houston, Texas.
Let the length of day serve as the sole input to asystem having an output equal to the average daily
temperature. Examining the plots of input andoutput, would you say that the system is linear or
not? How did you reach you conclusion?
Find the first five terms
(
,
... ,
)
of the complex Fourier series for each signal.Use the following formula that approximates the integral required to find the Fourier coefficients.
What is the harmonic distortion in the two signals?
Exclude
from this calculation.
Because the harmonic distortion is small, let's
concentrate only on the first harmonic. What is thephase shift between input and output signals?
Find the transfer function of the simplest possible
linear model that would describe the data.Characterize and interpret the structure of this
model. In particular, give a physical explanationfor the phase shift.
Predict what the output would be if the model had no
phase shift. Would days be hotter? If so, by howmuch?
Fourier transform pairs
Find the Fourier or inverse Fourier transform of the
following.
Duality in fourier transforms
"Duality" means that the Fourier transform and the inverse Fourier transform are very similar.
Consequently, the waveform
in the time domain and the spectrum
have a Fourier transform and an inverse Fourier transform, respectively, that are very similar.
Calculate the Fourier transform of the signal shown
below .
Calculate the inverse Fourier transform of the spectrum shown
below .
How are these answers related?
What is the general relationship between the Fourier transform of
and the inverse transform of
?
Spectra of pulse sequences
Pulse sequences occur often in digital communication and in other fields as well.
What are their spectral properties?
Calculate the Fourier transform of the single pulse shown
below .
Calculate the Fourier transform of the two-pulse sequence shown
below .
Calculate the Fourier transform for the
ten -pulse sequence shown in
below .
You should look for a general expression that holds for sequences of any length.
Using Matlab, plot the magnitudes of the three spectra.
Describe how the spectra change as the number of repeated pulses increases.
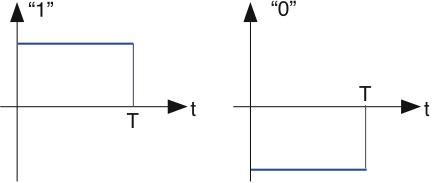
Spectra of digital communication signals
One way to represent bits with signals is shown in
[link] .
If the value of a bit is a “1”, it is represented by a positive pulse of duration
.
If it is a “0”, it is represented by a negative pulse of the same duration.To represent a sequence of bits, the appropriately chosen pulses are placed one after the other.
What is the spectrum of the waveform that represents the alternating bit sequence “...01010101...”?
This signal's bandwidth is defined to be the frequency range over which 90% of the power is contained.
What is this signal's bandwidth?
Suppose the bit sequence becomes “...00110011...”.
Now what is the bandwidth?
Questions & Answers
differentiate between demand and supply
giving examples
In economics, a perfect market refers to a theoretical construct where all participants have perfect information, goods are homogenous, there are no barriers to entry or exit, and prices are determined solely by supply and demand. It's an idealized model used for analysis,
When MP₁ becomes negative, TP start to decline.
Extuples Suppose that the short-run production function of certain cut-flower firm is given by: Q=4KL-0.6K2 - 0.112 •
Where is quantity of cut flower produced, I is labour input and K is fixed capital input (K-5). Determine the average product of lab
Kelo
Extuples Suppose that the short-run production function of certain cut-flower firm is given by: Q=4KL-0.6K2 - 0.112 •
Where is quantity of cut flower produced, I is labour input and K is fixed capital input (K-5). Determine the average product of labour (APL) and marginal product of labour (MPL)
Quantity demanded refers to the specific amount of a good or service that consumers are willing and able to purchase at a give price and within a specific time period. Demand, on the other hand, is a broader concept that encompasses the entire relationship between price and quantity demanded
Ezea
ok
Shukri
how do you save a country economic situation when it's falling apart
Economic growth as an increase in the production and consumption of goods and services within an economy.but
Economic development as a broader concept that encompasses not only economic growth but also social & human well being.
Shukri
production function means
Jabir
What do you think is more important to focus on when considering inequality ?
sir...I just want to ask one question... Define the term contract curve? if you are free please help me to find this answer 🙏
Asui
it is a curve that we get after connecting the pareto optimal combinations of two consumers after their mutually beneficial trade offs
Awais
thank you so much 👍 sir
Asui
In economics, the contract curve refers to the set of points in an Edgeworth box diagram where both parties involved in a trade cannot be made better off without making one of them worse off. It represents the Pareto efficient allocations of goods between two individuals or entities, where neither p
Cornelius
In economics, the contract curve refers to the set of points in an Edgeworth box diagram where both parties involved in a trade cannot be made better off without making one of them worse off. It represents the Pareto efficient allocations of goods between two individuals or entities,
Cornelius
Suppose a consumer consuming two commodities X and Y has
The following utility function u=X0.4 Y0.6. If the price of the X and Y are 2 and 3 respectively and income Constraint is birr 50.
A,Calculate quantities of x and y which maximize utility.
B,Calculate value of Lagrange multiplier.
C,Calculate quantities of X and Y consumed with a given price.
D,alculate optimum level of output .
the market for lemon has 10 potential consumers, each having an individual demand curve p=101-10Qi, where p is price in dollar's per cup and Qi is the number of cups demanded per week by the i th consumer.Find the market demand curve using algebra. Draw an individual demand curve and the market dema
suppose the production function is given by ( L, K)=L¼K¾.assuming capital is fixed find APL and MPL. consider the following short run production function:Q=6L²-0.4L³ a) find the value of L that maximizes output b)find the value of L that maximizes marginal product