| << Chapter < Page | Chapter >> Page > |
As a research method, either type of sociological experiment is useful for testing if-then statements: if a particular thing happens, then another particular thing will result. To set up a lab-based experiment, sociologists create artificial situations that allow them to manipulate variables.
Classically, the sociologist selects a set of people with similar characteristics, such as age, class, race, or education. Those people are divided into two groups. One is the experimental group and the other is the control group. The experimental group is exposed to the independent variable(s) and the control group is not. To test the benefits of tutoring, for example, the sociologist might expose the experimental group of students to tutoring but not the control group. Then both groups would be tested for differences in performance to see if tutoring had an effect on the experimental group of students. As you can imagine, in a case like this, the researcher would not want to jeopardize the accomplishments of either group of students, so the setting would be somewhat artificial. The test would not be for a grade reflected on their permanent record, for example.

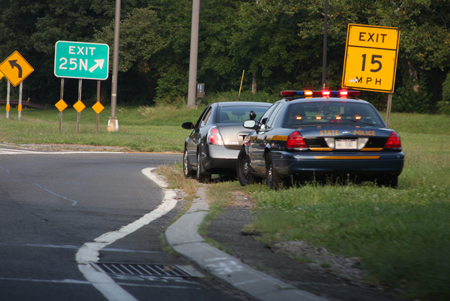
A real-life example will help illustrate the experiment process. In 1971, Frances Heussenstamm, a sociology professor at California State University at Los Angeles, had a theory about police prejudice. To test her theory she conducted an experiment. She chose fifteen students from three ethnic backgrounds: black, white, and Hispanic. She chose students who routinely drove to and from campus along Los Angeles freeway routes, and who’d had perfect driving records for longer than a year. Those were her independent variables—students, good driving records, same commute route.
Next, she placed a Black Panther bumper sticker on each car. That sticker, a representation of a social value, was the independent variable. In the 1970s, the Black Panthers were a revolutionary group actively fighting racism. Heussenstamm asked the students to follow their normal driving patterns. She wanted to see whether seeming support of the Black Panthers would change how these good drivers were treated by the police patrolling the highways. The dependent variable would be the number of traffic stops/citations.
The first arrest, for an incorrect lane change, was made two hours after the experiment began. One participant was pulled over three times in three days. He quit the study. After seventeen days, the fifteen drivers had collected a total of thirty-three traffic citations. The experiment was halted. The funding to pay traffic fines had run out, and so had the enthusiasm of the participants (Heussenstamm 1971).
While sociologists often engage in original research studies, they also contribute knowledge to the discipline through secondary data analysis . Secondary data don’t result from firsthand research collected from primary sources, but are the already completed work of other researchers. Sociologists might study works written by historians, economists, teachers, or early sociologists. They might search through periodicals, newspapers, or magazines from any period in history.

Notification Switch
Would you like to follow the 'Introduction to sociology 2e' conversation and receive update notifications?