

| << Chapter < Page | Chapter >> Page > |
There can be no doubt of the rising trends, and there are disturbing signs of systematic change in other indicators as well ( Arndt, et al., 2010 ). The short-term extension of these trends can be estimated by extrapolation. Prediction beyond thirty or so years requires developing scenarios based on assumptions about the population, social behavior, economy, energy use and technology advances that will take place during this time. Because trends in these quantities are frequently punctuated by unexpected developments such as the recession of 2008 or the Fukushima nuclear disaster of 2011, the pace of carbon emissions, global warming and climate change over a century or more cannot be accurately predicted. To compensate for this uncertainty, predictions are normally based on a range of scenarios with aggressive and conservative assumptions about the degrees of population and economic growth, energy use patterns and technology advances. Although the hundred year predictions of such models differ in magnitude, the common theme is clear: continued reliance on fossil fuel combustion for 85 percent of global energy will accelerate global warming and increase the threat of climate change.
The present reliance on fossil fuels developed over time scales of decades to centuries. Figure Primary Energy Consumption by Source, 1775-2009 shows the pattern of fuel use in the United States since 1775.
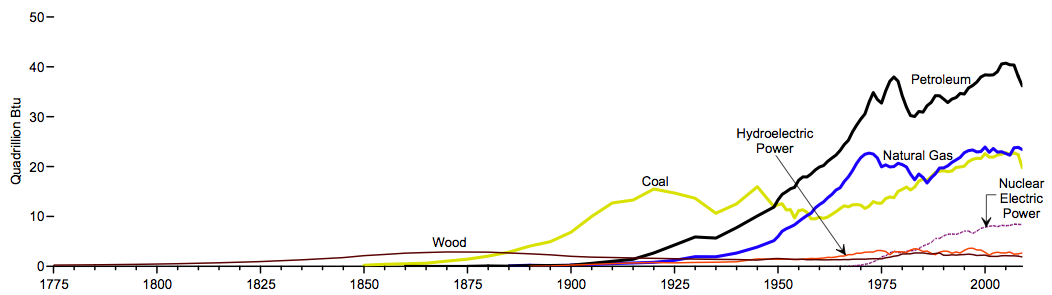
Wood was dominant for a century until the 1880s, when more plentiful, higher energy density and less expensive coal became king. It dominated until the 1950s when oil for transportation became the leading fuel, with natural gas for heating a close second. Coal is now in its second growth phase, spurred by the popularity of electricity as an energy carrier in the second half of the 20 th Century. These long time scales are built into the energy system. Uses such as oil and its gasoline derivative for personal transportation in cars or the widespread use of electricity take time to establish themselves, and once established provide social and infrastructural inertia against change.
The historical changes to the energy system have been driven by several factors, including price and supply challenges of wood, the easy availability and drop-in replaceability of coal for wood, the discovery of abundant supplies of oil that enabled widespread use of the internal combustion engine , and the discovery of abundant natural gas that is cleaner and more transportable in pipelines than coal. These drivers of change are based on economics, convenience or new functionality; the resulting changes in our energy system provided new value to our energy mix.
The energy motivations we face now are of a different character. Instead of adding value, the motivation is to avert "doomsday" scenarios of diminishing value: increasing environmental degradation, fuel shortages, insecure supplies and climate change. The alternatives to fossil fuel are more expensive and harder to implement, not cheaper and easier than the status quo. The historical motivations for change leading to greater value and functionality are reversed. We now face the prospect that changing the energy system to reduce our dependence on fossil fuels will increase the cost and reduce the convenience of energy.
Continued use of fossil fuels that now supply 85 percent of our energy needs leads to challenges of environmental degradation, diminishing energy resources, insecure energy supply, and accelerated global warming. Changing to alternate sources of energy requires decades, to develop new technologies and, once developed, to replace the existing energy infrastructure. Unlike the historical change to fossil fuel that provided increased supply, convenience and functionality, the transition to alternative energy sources is likely to be more expensive and less convenient. In this chapter you will learn about the environmental challenges of energy use, strategies for mitigating greenhouse gas emissions and climate change, electricity as a clean, efficient and versatile energy carrier, the new challenges that electricity faces in capacity, reliability and communication, the challenge of transitioning from traditional fossil to nuclear and renewable fuels for electricity production. You will also learn about the promise of biofuels from cellulose and algae as alternatives to oil, heating buildings and water with solar thermal and geothermal energy, and the efficiency advantages of combining heat and power in a single generation system. Lastly, you will learn about the benefits, challenges and outlook for electric vehicles, and the sustainable energy practices that will reduce the negative impact of energy production and use on the environment and human health.
Fossil fuels have become a mainstay of global energy supply over the last 150 years. Why is the use of fossil fuels so widespread?
Fossil fuels present four challenges for long-term sustainability. What are they, and how do they compare in the severity of their impact and cost of their mitigation strategies?
The dominant global energy supply has changed from wood to coal to oil since the 1700s. How long did each of these energy transitions take to occur, and how long might a transition to alternate energy supplies require?
Arndt, D. S., Baringer, M. O.,&Johnson, M. R. (eds.). (2010). State of the Climate in 2009. Bull. Amer. Meteor. Soc ., 91 , S1–S224, (External Link)
Hirsch, R.L., Bezdek, R.,&Wendling, R. (2006). Peaking of World Oil Production and Its Mitigation. AIChE Journal , 52 , 2 – 8. doi: 10.1002/aic.10747
Owen, N.A., Inderwildi, O.R.,&King, D.A. (2010). The status of conventional world oil reserves – Hype or cause for concern? Energy Policy, 38 , 4743 – 4749. doi: 10.1016/j.enpol.2010.02.026
Notification Switch
Would you like to follow the 'Sustainability: a comprehensive foundation' conversation and receive update notifications?

|
|

|
|

|
|

|
|

|
|

|
|

|
|

|
|

|
|

|