<< Chapter < Page Chapter >> Page >

Responses to price changes: substitution and income effects

A higher price for a good will cause the budget constraint to shift to the left, so that it is tangent to a lower indifference curve representing a reduced level of utility. Conversely, a lower price for a good will cause the opportunity set to shift to the right, so that it is tangent to a higher indifference curve representing an increased level of utility. Exactly how much a change in price will lead to the quantity demanded of each good will depend on personal preferences.

Anyone who faces a change in price will experience two interlinked motivations: a substitution effect and an income effect. The substitution effect is that when a good becomes more expensive, people seek out substitutes. If oranges become more expensive, fruit-lovers scale back on oranges and eat more apples, grapefruit, or raisins. Conversely, when a good becomes cheaper, people substitute toward consuming more. If oranges get cheaper, people fire up their juicing machines and ease off on other fruits and foods. The income effect refers to how a change in the price of a good alters the effective buying power of one’s income. If the price of a good that you have been buying falls, then in effect your buying power has risen—you are able to purchase more goods. Conversely, if the price of a good that you have been buying rises, then the buying power of a given amount of income is diminished. (One common source of confusion is that the “income effect” does not refer to a change in actual income. Instead, it refers to the situation in which the price of a good changes, and thus the quantities of goods that can be purchased with a fixed amount of income change. It might be more accurate to call the “income effect” a “buying power effect,” but the “income effect” terminology has been used for decades, and it is not going to change during this economics course.) Whenever a price changes, consumers feel the pull of both substitution and income effects at the same time.

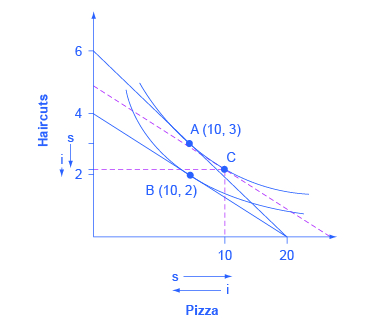
Using indifference curves, you can illustrate the substitution and income effects on a graph. In [link] , Ogden faces a choice between two goods: haircuts or personal pizzas. Haircuts cost $20, personal pizzas cost $6, and he has $120 to spend.

Substitution and income effects

The graph shows two indifference curves with points A (10, 3) and B (10, 2) marked on the curves. Point C is also marked as the intersecting point of two dashed lines. The x-axis is marked pizza and shows an arrow next to “s” point to the right and an arrow next to “i” pointing to the left.The y-axis is market “haircuts” and sows downward pointing arrows for both “s” and “i.”
The original choice is A, the point of tangency between the original budget constraint and indifference curve. The new choice is B, the point of tangency between the new budget constraint and the lower indifference curve. Point C is the tangency between the dashed line, where the slope shows the new higher price of haircuts, and the original indifference curve. The substitution effect is the shift from A to C, which means getting fewer haircuts and more pizza. The income effect is the shift from C to B; that is, the reduction in buying power that causes a shift from the higher indifference curve to the lower indifference curve, with relative prices remaining unchanged. The income effect results in less consumed of both goods. Both substitution and income effects cause fewer haircuts to be consumed. For pizza, in this case, the substitution effect and income effect cancel out, leading to the same amount of pizza consumed.

Questions & Answers

how do you get the 2/50
Abba Reply
number of sport play by 50 student construct discrete data
Aminu Reply
width of the frangebany leaves on how to write a introduction
Theresa Reply
Solve the mean of variance
Veronica Reply
Step 1: Find the mean. To find the mean, add up all the scores, then divide them by the number of scores. ... Step 2: Find each score's deviation from the mean. ... Step 3: Square each deviation from the mean. ... Step 4: Find the sum of squares. ... Step 5: Divide the sum of squares by n – 1 or N.
kenneth
what is error
Yakuba Reply
Is mistake done to something
Vutshila
Hy
anas
hy
What is the life teble
anas
hy
Jibrin
statistics is the analyzing of data
Tajudeen Reply
what is statics?
Zelalem Reply
how do you calculate mean
Gloria Reply
diveving the sum if all values
Shaynaynay
let A1,A2 and A3 events be independent,show that (A1)^c, (A2)^c and (A3)^c are independent?
Fisaye Reply
what is statistics
Akhisani Reply
data collected all over the world
Shaynaynay
construct a less than and more than table
Imad Reply
The sample of 16 students is taken. The average age in the sample was 22 years with astandard deviation of 6 years. Construct a 95% confidence interval for the age of the population.
Aschalew Reply
Bhartdarshan' is an internet-based travel agency wherein customer can see videos of the cities they plant to visit. The number of hits daily is a normally distributed random variable with a mean of 10,000 and a standard deviation of 2,400 a. what is the probability of getting more than 12,000 hits? b. what is the probability of getting fewer than 9,000 hits?
Akshay Reply
Bhartdarshan'is an internet-based travel agency wherein customer can see videos of the cities they plan to visit. The number of hits daily is a normally distributed random variable with a mean of 10,000 and a standard deviation of 2,400. a. What is the probability of getting more than 12,000 hits
Akshay
1
Bright
Sorry i want to learn more about this question
Bright
Someone help
Bright
a= 0.20233 b=0.3384
Sufiyan
a
Shaynaynay
How do I interpret level of significance?
Mohd Reply
It depends on your business problem or in Machine Learning you could use ROC- AUC cruve to decide the threshold value
Shivam
how skewness and kurtosis are used in statistics
Owen Reply
yes what is it
Taneeya
Got questions? Join the online conversation and get instant answers!
Jobilize.com Reply

Get Jobilize Job Search Mobile App in your pocket Now!

Get it on Google Play Download on the App Store Now


Source:  OpenStax, Microeconomics. OpenStax CNX. Aug 03, 2014 Download for free at http://legacy.cnx.org/content/col11627/1.10
Google Play and the Google Play logo are trademarks of Google Inc.

Notification Switch

Would you like to follow the 'Microeconomics' conversation and receive update notifications?

Ask