

| << Chapter < Page | Chapter >> Page > |
The screen output
When you open the html file in your browser, the text shown in Figure 7 should appear in your browser window.
| Figure 7 . Screen output for Listing #3. |
|---|
time = 0 height = 10000
time = 2 height = 9936time = 4 height = 9743
time = 6 height = 9421time = 8 height = 8970
time = 10 height = 8391time = 12 height = 7683
time = 14 height = 6847time = 16 height = 5882
time = 18 height = 4788time = 20 height = 3565
time = 22 height = 2214time = 24 height = 734
time = 26 height = 0time = 28 height = 0
time = 30 height = 0The End |
Plot the data
Using pushpins, rubber bands, pipe cleaners, or whatever works best for you, plot the 16 points shown in Figure 7 on your graph board. Your horizontal axis should be the time axis and your vertical axis should be the height axis.
If we have both done everything correctly, the shape of your curve should be an upside-down parabola with its high point at a value of 10000. (If the wordparabola is new to you, don't worry about it. It's not important for the purpose of this module.)
The tactile graph
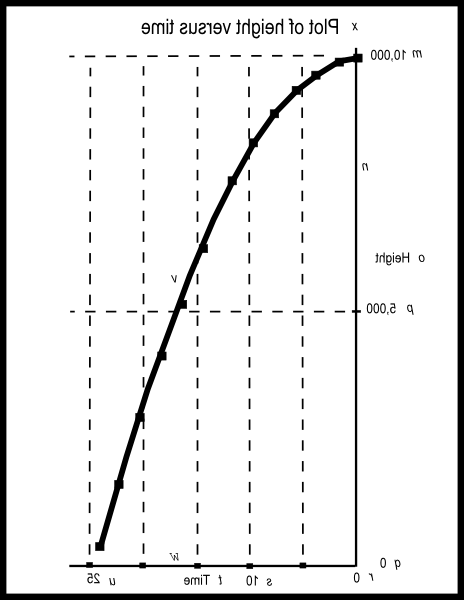
For the benefit of your assistant who will create the tactile graph, Figure 8 shows the image that is contained in the file named Phy1050.svg. As usual, this is a mirror image of the actual image in anticipation of the fact that yourassistant will emboss the image from the back side of the paper. A non-mirror-image version of this same image is shown in Figure 10 .
| Figure 8 . Image from the file named Phy1050a1.svg. |
|---|
 |
Key-value pairs
Hopefully, by now you are familiar with the concept of key-value pairs as used in these modules. If not, please go back and study the section on Key-valuepairs in conjunction with Figure 2 of the module named Manual Creation of Tactile Graphics .
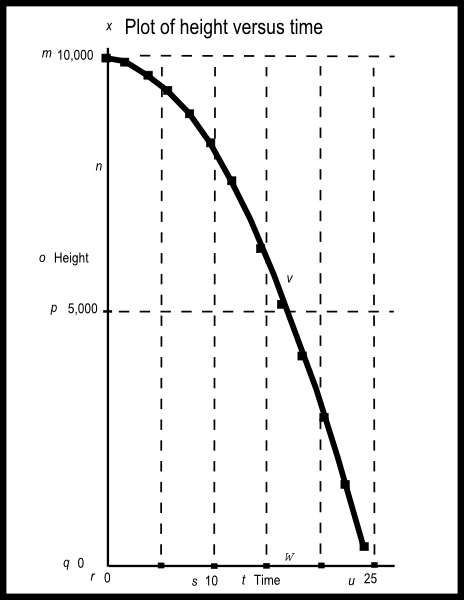
Figure 9 below contains the key-value table for the image shown in Figure 8 .
| Figure 9 . Key-value table for the image shown in Figure 8. |
|---|
m: 10,000
n: Vertical axiso: Height
p: 5,000q: 0
r: 0s: 10
t: Timeu: 25
v: Height versus time curvew: Horizontal axis
x: Plot of height versus time |
Change in height increases with time
Getting back to the height versus time values shown in Figure 7 and plotted on your graph board or tactile graph, the value forheight should decrease for each successive time value.
However, the change in height should increase for each successive time interval until theheight goes to zero. The height goes to zero when the rock has landed on the ground somewhere between 24 and 26 seconds. It continues at zero after that.
(Note that I put code into the script to prevent the value of height from going negative.)
The increase in the change in the height value during each successive time interval is the result of the time being squared in the equation given earlier . It is also the result of the acceleration of gravity that causes the downward speed of the rock to increaseas the rock falls.
Analysis of the code
Listing 3 calls a function copied from the previous exercise inside a while loop to compute the distance traveled and the resulting height for a series of time values ranging from 0 to 30 seconds intwo-second intervals.
Those values are displayed as shown in Figure 7 .
Understanding the code in Listing 2 and Listing 3 is important. However, it is more important at this point that you understand the handling of units asshown in the comments in the code.
Figure 8 shows the actual mirror image contained in the file named Phy1050a1.svg. Figure 10 shows a non-mirror-image version of that same image.
| Figure 10 . Non-mirror-image version of the image from the file named Phy1050a1.svg. |
|---|
 |
I encourage you to run the scripts that I have presented in this lesson to confirm that you get the same results. Copy the code for each script into atext file with an extension of html. Then open that file in your browser. Experiment with the code, making changes, and observing the results of your changes. Makecertain that you can explain why your changes behave as they do.
I will publish a module containing consolidated links to resources on my Connexions web page and will update and add to the list as additional modulesin this collection are published.
This section contains a variety of miscellaneous information.
Financial : Although the openstax CNX site makes it possible for you to download a PDF file for the collection that contains thismodule at no charge, and also makes it possible for you to purchase a pre-printed version of the PDF file, you should beaware that some of the HTML elements in this module may not translate well into PDF.
You also need to know that Prof. Baldwin receives no financial compensation from openstax CNX even if you purchase the PDF version of the collection.
In the past, unknown individuals have copied Prof. Baldwin's modules from cnx.org, converted them to Kindle books, and placed them for sale on Amazon.com showing Prof. Baldwin as the author.Prof. Baldwin neither receives compensation for those sales nor does he know who doesreceive compensation. If you purchase such a book, please be aware that it is a copy of a collection that is freelyavailable on openstax CNX and that it was made and published without the prior knowledge of Prof. Baldwin.
Affiliation : Prof. Baldwin is a professor of Computer Information Technology at Austin Community College in Austin, TX.
-end-
Notification Switch
Would you like to follow the 'Accessible physics concepts for blind students' conversation and receive update notifications?

|
|

|
|

|
|

|
|

|
|

|
|

|
|

|
|

|
|

|