The student will demonstrate and compare properties of the Central Limit Theorem.
Given:
= length of time (in days) that a cookie recipe lasted at the Olmstead Homestead.
(Assume that each of the different recipes makes the same quantity of cookies.)
Recipe #
Recipe #
Recipe #
Recipe #
1
1
16
2
31
3
46
2
2
5
17
2
32
4
47
2
3
2
18
4
33
5
48
11
4
5
19
6
34
6
49
5
5
6
20
1
35
6
50
5
6
1
21
6
36
1
51
4
7
2
22
5
37
1
52
6
8
6
23
2
38
2
53
5
9
5
24
5
39
1
54
1
10
2
25
1
40
6
55
1
11
5
26
6
41
1
56
2
12
1
27
4
42
6
57
4
13
1
28
1
43
2
58
3
14
3
29
6
44
6
59
6
15
2
30
2
45
2
60
5
Calculate the following:
Collect the data
Use a random number generator to randomly select 4 samples of size
from the given
population. Record your samples below. Then, for each sample, calculate the mean to the nearesttenth. Record them in the spaces provided. Record the sample means for the rest of the class.
Complete the table:
Sample 1
Sample 2
Sample 3
Sample 4
Sample means from other groups:
Means:
Calculate the following:
Again, use a random number generator to randomly select 4 samples from the population. This time, make the samples of size
. Record the samples below. As before, for each sample, calculate the mean to the nearest tenth. Record them in the spaces provided. Record the sample means for the rest of the class.
Sample 1
Sample 2
Sample 3
Sample 4
Sample means from other groups:
Means:
Calculate the following:
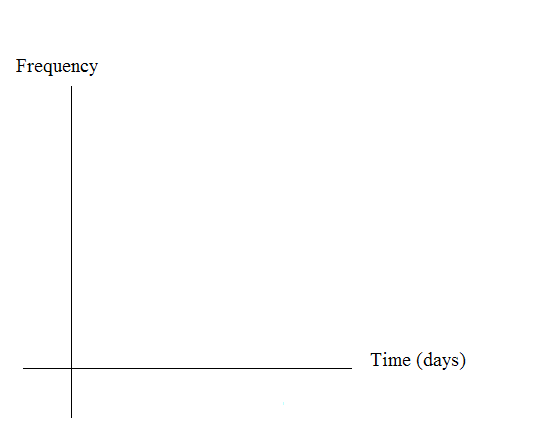
For the original population, construct a histogram. Make intervals with bar width = 1 day.
Sketch the graph using a ruler and pencil. Scale the axes.
Draw a smooth curve through the tops of the bars of the histogram. Use 1 – 2 complete
sentences to describe the general shape of the curve.
Repeat the procedure for n=5
For the sample of
averaged together, construct a histogram of the averages (your means together with the means of the other groups). Make
intervals with
. Sketch the graph using a ruler and pencil. Scale the axes.
Draw a smooth curve through the tops of the bars of the histogram. Use 1 – 2 complete
sentences to describe the general shape of the curve.
Repeat the procedure for n=10
For the sample of
averaged together, construct a histogram of the averages (your means together with the means of the other groups). Make
intervals with
. Sketch the graph using a ruler and pencil. Scale the axes.
Draw a smooth curve through the tops of the bars of the histogram. Use 1 – 2 complete
sentences to describe the general shape of the curve.
Discussion questions
Compare the three histograms you have made, the one for the population and the two for the
sample means. In three to five sentences, describe the similarities and differences.
State the theoretical (according to the CLT) distributions for the sample means.
:
~
:
~
Are the sample means for
and
“close” to the theoretical mean,
?
Explain why or why not.
Which of the two distributions of sample means has the smaller standard deviation? Why?
As n changed, why did the shape of the distribution of the data change? Use 1 – 2 complete
sentences to explain what happened.
This lab was designed and contributed by Carol Olmstead.
Bacteria doesn't produce energy they are dependent upon their substrate in case of lack of nutrients they are able to make spores which helps them to sustain in harsh environments
_Adnan
But not all bacteria make spores, l mean Eukaryotic cells have Mitochondria which acts as powerhouse for them, since bacteria don't have it, what is the substitution for it?
Assimilatory nitrate reduction is a process that occurs in some microorganisms, such as bacteria and archaea, in which nitrate (NO3-) is reduced to nitrite (NO2-), and then further reduced to ammonia (NH3).
Elkana
This process is called assimilatory nitrate reduction because the nitrogen that is produced is incorporated in the cells of microorganisms where it can be used in the synthesis of amino acids and other nitrogen products
There are nothing like emergency disease but there are some common medical emergency which can occur simultaneously like Bleeding,heart attack,Breathing difficulties,severe pain heart stock.Hope you will get my point .Have a nice day ❣️
_Adnan
define infection ,prevention and control
Innocent
I think infection prevention and control is the avoidance of all things we do that gives out break of infections and promotion of health practices that promote life