<< Chapter < Page Chapter >> Page >

Exchange rate market for u.s. dollars reacts to higher interest rates

The graph shows how supply and demand would change if the U.S. dollar brought a higher rate of return.
A higher rate of return for U.S. dollars makes holding dollars more attractive. Thus, the demand for dollars in the foreign exchange market shifts to the right, from D 0 to D 1 , while the supply of dollars shifts to the left, from S 0 to S 1 . The new equilibrium (E 1 ) has a stronger exchange rate than the original equilibrium (E 0 ), but in this example, the equilibrium quantity traded does not change.

Relative inflation

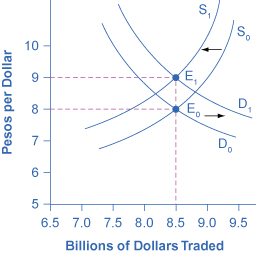
If a country experiences a relatively high inflation rate compared with other economies, then the buying power of its currency is eroding, which will tend to discourage anyone from wanting to acquire or to hold the currency. [link] shows an example based on an actual episode concerning the Mexican peso. In 1986–87, Mexico experienced an inflation rate of over 200%. Not surprisingly, as inflation dramatically decreased the purchasing power of the peso in Mexico, the exchange rate value of the peso declined as well. As shown in [link] , demand for the peso on foreign exchange markets decreased from D 0 to D 1 , while supply of the peso increased from S 0 to S 1 . The equilibrium exchange rate fell from $2.50 per peso at the original equilibrium (E 0 ) to $0.50 per peso at the new equilibrium (E 1 ). In this example, the quantity of pesos traded on foreign exchange markets remained the same, even as the exchange rate shifted.

Exchange rate markets react to higher inflation

The graph shows how supply and demand would change if the pesos experienced inflation.
If a currency is experiencing relatively high inflation, then its buying power is decreasing and international investors will be less eager to hold it. Thus, a rise in inflation in the Mexican peso would lead demand to shift from D 0 to D 1 , and supply to increase from S 0 to S 1 . Both movements in demand and supply would cause the currency to depreciate. The effect on the quantity traded is drawn here as a decrease, but in truth it could be an increase or no change, depending on the actual movements of demand and supply.

Visit this website to learn about the Big Mac index.

Purchasing power parity

Over the long term, exchange rates must bear some relationship to the buying power of the currency in terms of goods that are internationally traded. If at a certain exchange rate it was much cheaper to buy internationally traded goods—such as oil, steel, computers, and cars—in one country than in another country, businesses would start buying in the cheap country, selling in other countries, and pocketing the profits.

For example, if a U.S. dollar is worth $1.60 in Canadian currency, then a car that sells for $20,000 in the United States should sell for $32,000 in Canada. If the price of cars in Canada was much lower than $32,000, then at least some U.S. car-buyers would convert their U.S. dollars to Canadian dollars and buy their cars in Canada. If the price of cars was much higher than $32,000 in this example, then at least some Canadian buyers would convert their Canadian dollars to U.S. dollars and go to the United States to purchase their cars. This is known as arbitrage    , the process of buying and selling goods or currencies across international borders at a profit. It may occur slowly, but over time, it will force prices and exchange rates to align so that the price of internationally traded goods is similar in all countries.

Questions & Answers

differentiate between demand and supply giving examples
Lambiv Reply
differentiated between demand and supply using examples
Lambiv
what is labour ?
Lambiv
how will I do?
Venny Reply
how is the graph works?I don't fully understand
Rezat Reply
information
Eliyee
devaluation
Eliyee
t
WARKISA
hi guys good evening to all
Lambiv
multiple choice question
Aster Reply
appreciation
Eliyee
explain perfect market
Lindiwe Reply
In economics, a perfect market refers to a theoretical construct where all participants have perfect information, goods are homogenous, there are no barriers to entry or exit, and prices are determined solely by supply and demand. It's an idealized model used for analysis,
Ezea
What is ceteris paribus?
Shukri Reply
other things being equal
AI-Robot
When MP₁ becomes negative, TP start to decline. Extuples Suppose that the short-run production function of certain cut-flower firm is given by: Q=4KL-0.6K2 - 0.112 • Where is quantity of cut flower produced, I is labour input and K is fixed capital input (K-5). Determine the average product of lab
Kelo
Extuples Suppose that the short-run production function of certain cut-flower firm is given by: Q=4KL-0.6K2 - 0.112 • Where is quantity of cut flower produced, I is labour input and K is fixed capital input (K-5). Determine the average product of labour (APL) and marginal product of labour (MPL)
Kelo
yes,thank you
Shukri
Can I ask you other question?
Shukri
what is monopoly mean?
Habtamu Reply
What is different between quantity demand and demand?
Shukri Reply
Quantity demanded refers to the specific amount of a good or service that consumers are willing and able to purchase at a give price and within a specific time period. Demand, on the other hand, is a broader concept that encompasses the entire relationship between price and quantity demanded
Ezea
ok
Shukri
how do you save a country economic situation when it's falling apart
Lilia Reply
what is the difference between economic growth and development
Fiker Reply
Economic growth as an increase in the production and consumption of goods and services within an economy.but Economic development as a broader concept that encompasses not only economic growth but also social & human well being.
Shukri
production function means
Jabir
What do you think is more important to focus on when considering inequality ?
Abdisa Reply
any question about economics?
Awais Reply
sir...I just want to ask one question... Define the term contract curve? if you are free please help me to find this answer 🙏
Asui
it is a curve that we get after connecting the pareto optimal combinations of two consumers after their mutually beneficial trade offs
Awais
thank you so much 👍 sir
Asui
In economics, the contract curve refers to the set of points in an Edgeworth box diagram where both parties involved in a trade cannot be made better off without making one of them worse off. It represents the Pareto efficient allocations of goods between two individuals or entities, where neither p
Cornelius
In economics, the contract curve refers to the set of points in an Edgeworth box diagram where both parties involved in a trade cannot be made better off without making one of them worse off. It represents the Pareto efficient allocations of goods between two individuals or entities,
Cornelius
Suppose a consumer consuming two commodities X and Y has The following utility function u=X0.4 Y0.6. If the price of the X and Y are 2 and 3 respectively and income Constraint is birr 50. A,Calculate quantities of x and y which maximize utility. B,Calculate value of Lagrange multiplier. C,Calculate quantities of X and Y consumed with a given price. D,alculate optimum level of output .
Feyisa Reply
Answer
Feyisa
c
Jabir
the market for lemon has 10 potential consumers, each having an individual demand curve p=101-10Qi, where p is price in dollar's per cup and Qi is the number of cups demanded per week by the i th consumer.Find the market demand curve using algebra. Draw an individual demand curve and the market dema
Gsbwnw Reply
suppose the production function is given by ( L, K)=L¼K¾.assuming capital is fixed find APL and MPL. consider the following short run production function:Q=6L²-0.4L³ a) find the value of L that maximizes output b)find the value of L that maximizes marginal product
Abdureman
types of unemployment
Yomi Reply
What is the difference between perfect competition and monopolistic competition?
Mohammed

Get Jobilize Job Search Mobile App in your pocket Now!

Get it on Google Play Download on the App Store Now


Source:  OpenStax, Principles of economics. OpenStax CNX. Sep 19, 2014 Download for free at http://legacy.cnx.org/content/col11613/1.11
Google Play and the Google Play logo are trademarks of Google Inc.

Notification Switch

Would you like to follow the 'Principles of economics' conversation and receive update notifications?

Ask