

| << Chapter < Page | Chapter >> Page > |
Neoclassical economists will not tend to see aggregate demand as a useful tool for reducing unemployment; after all, if economic output is determined by a vertical aggregate supply curve , then aggregate demand has no long-run effect on unemployment. Instead, neoclassical economists believe that aggregate demand should be allowed to expand only to match the gradual shifts of aggregate supply to the right—keeping the price level much the same and inflationary pressures low.
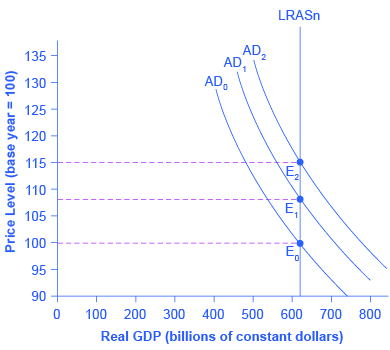
If aggregate demand rises rapidly in the neoclassical model, in the long run it leads only to inflationary pressures. [link] shows a vertical LRAS curve and three different levels of aggregate demand, rising from AD 0 to AD 1 to AD 2 . As the macroeconomic equilibrium rises from E 0 to E 1 to E 2 , the price level rises, but real GDP does not budge; nor does the rate of unemployment, which adjusts to its natural rate. Conversely, reducing inflation has no long-term costs, either. Think about [link] in reverse, as the aggregate demand curve shifts from AD 2 to AD 1 to AD 0 , and the equilibrium moves from E 2 to E 1 to E 0 . During this process, the price level falls, but, in the long run, neither real GDP nor the natural rate of unemployment is changed.
Visit this website to read about how inflation and unemployment are related.
Neoclassical economists believe that the economy will rebound out of a recession or eventually contract during an expansion because prices and wage rates are flexible and will adjust either upward or downward to restore the economy to its potential GDP. Thus, the key policy question for neoclassicals is how to promote growth of potential GDP. We know that economic growth ultimately depends on the growth rate of long-term productivity. Productivity measures how effective inputs are at producing outputs. We know that U.S. productivity has grown on average about 2% per year. That means that the same amount of inputs produce 2% more output than the year before. We also know that productivity growth varies a great deal in the short term due to cyclical factors. It also varies somewhat in the long term. From 1953–1972, U.S. labor productivity (as measured by output per hour in the business sector) grew at 3.2% per year. From 1973–1992, productivity growth declined significantly to 1.8% per year. Then, from 1993–2014, productivity growth increased slightly to 2% per year. The neoclassical economists believe the underpinnings of long-run productivity growth to be an economy’s investments in human capital, physical capital, and technology, operating together in a market-oriented environment that rewards innovation. Promotion of these factors is what government policy should focus on.
Let’s summarize what neoclassical economists recommend for macroeconomic policy. Neoclassical economists do not believe in “fine-tuning” the economy. They believe that economic growth is fostered by a stable economic environment with a low rate of inflation. Similarly, tax rates should be low and unchanging. In this environment, private economic agents can make the best possible investment decisions, which will lead to optimal investment in physical and human capital as well as research and development to promote improvements in technology.
[link] summarizes the key differences between the two schools of thought.
| Summary | Neoclassical Economics | Keynesian Economics |
|---|---|---|
| Focus: long-term or short term | Long-term | Short-term |
| Prices and wages: sticky or flexible? | Flexible | Sticky |
| Economic output: Primarily determined by aggregate demand or aggregate supply? | Aggregate supply | Aggregate demand |
| Aggregate supply: vertical or upward-sloping? | Vertical | Upward-sloping |
| Phillips curve vertical or downward-sloping | Vertical | Downward sloping |
| Is aggregate demand a useful tool for controlling inflation? | Yes | Yes |
| What should be the primary area of policy emphasis for reducing unemployment? | Reform labor market institutions to reduce natural rate of unemployment | Increase aggregate demand to eliminate cyclical unemployment |
| Is aggregate demand a useful tool for ending recession? | At best, only in the short-run temporary sense, but may just increase inflation instead | Yes |
Neoclassical economists tend to put relatively more emphasis on long-term growth than on fighting recession, because they believe that recessions will fade in a few years and long-term growth will ultimately determine the standard of living. They tend to focus more on reducing the natural rate of unemployment caused by economic institutions and government policies than the cyclical unemployment caused by recession.
Neoclassical economists also see no social benefit to inflation. With an upward-sloping Keynesian AS curve, inflation can arise because an economy is approaching full employment. With a vertical long-run neoclassical AS curve, inflation does not accompany any rise in output. If aggregate supply is vertical, then aggregate demand does not affect the quantity of output. Instead, aggregate demand can only cause inflationary changes in the price level. A vertical aggregate supply curve, where the quantity of output is consistent with many different price levels, also implies a vertical Phillips curve.
American Statistical Association. “ASA Headlines.” http://www.amstat.org/.
Haubrich, Joseph G., George Pennacchi, and Peter Ritchken. “Working Paper 11-07: Inflation Expectations, Real Rates, and Risk Premia: Evidence from Inflation Swaps.” Federal Reserve Bank of Cleveland . Last modified March 2011. http://www.clevelandfed.org/research/workpaper/2011/wp1107.pdf.
University of Michigan: Institute for Social Research. “Survey Research Center.” http://www.src.isr.umich.edu/.
Notification Switch
Would you like to follow the 'Principles of economics' conversation and receive update notifications?

|
|

|
|

|
|

|
|

|
|

|
|

|
|

|
|

|
|

|
|

|