

| << Chapter < Page | Chapter >> Page > |
The kind of motion exhibited by a simple pendulum is often referred to as periodic motion in general, and simple harmonic motion in particular.
Other devices that exhibit periodic motion may exhibit more complex harmonic motion. For example, Figure 2 illustrates a more complex form of harmonic motion.
| Figure 2. Complex harmonic motion. |
|---|
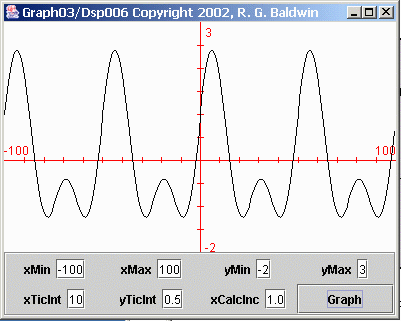 |
As you can see, the positive excursions are greater than the negative excursions in Figure 2 . In addition, the negative excursions exhibit some ripple that is not exhibited by the positive excursions.
Figure 2 is a plot of the following Java expression:
Math.cos(2*pi*x/50)
+ Math.sin(2*pi*x/50)+ Math.sin(2*pi*x/25); Figure 1 shows a curve whose shape is commonly referred to as a sinusoid. Eliminating the syntax required by the Java programming language, the expressionused to produce the data plotted in Figure 1 was:
f(x) = cos(2*pi*x/50) + sin(2*pi*x/50)
As you can see, this function is composed of two components, one cosine component and one sine component.
Figure 3 shows separate plots of the two components that were added together to produce the plot in Figure 1 .
| Figure 3. Separate cosine and sine functions. |
|---|
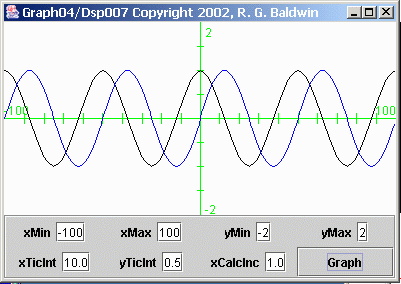 |
The black curve in Figure 3 shows the cosine function produced by evaluating and plotting the following equation:
f(x) = cos(2*pi*x/50)
The blue curve shows the sine function produced by evaluating and plotting the following equation:
g(x) = sin(2*pi*x/50)
The point-by-point sum of these two curves would produce the sinusoidal curve shown in Figure 1 .
Many processes produce functions whose values vary over time. For example, the temperature in your office is a function that varies continuously with time.
(The temperature in your office is probably not a periodic function because the temperature probably doesn't repeat its values on any periodicbasis).
If you were to measure and record the temperature in your office once each minute, you could plot the recorded values in the manner shown in Figure 1 through Figure 3 . You could plot the temperature along the vertical axis against time (or sample number) along the horizontal axis.
A common name for sampled data of this type is time series. That name reflects the fact that your data is a recording of the temperaturevalues for a series of measurements that occur over time. (I will have quite a lot more to say about time series in future modules.)
Figure 4 is very similar to Figure 3 . However, there is one major difference. In Figure 3 , the repetition period of the sine and cosine functions is the same. In other words, the shape of the sine function is the same as the shape of thecosine function. They are simply shifted relative to one another along the horizontal axis.
Each of the curves in Figure 3 has the same period, where the period is the horizontal distance from one peak to the next.
Notification Switch
Would you like to follow the 'Digital signal processing - dsp' conversation and receive update notifications?

|
|

|
|
|
|

|
|

|
|

|
|

|
|
|
|
|

|
|

|