<< Chapter < Page Chapter >> Page >
  • Plot a curve described by parametric equations.
  • Convert the parametric equations of a curve into the form y = f ( x ) .
  • Recognize the parametric equations of basic curves, such as a line and a circle.
  • Recognize the parametric equations of a cycloid.

In this section we examine parametric equations and their graphs. In the two-dimensional coordinate system, parametric equations are useful for describing curves that are not necessarily functions. The parameter is an independent variable that both x and y depend on, and as the parameter increases, the values of x and y trace out a path along a plane curve. For example, if the parameter is t (a common choice), then t might represent time. Then x and y are defined as functions of time, and ( x ( t ) , y ( t ) ) can describe the position in the plane of a given object as it moves along a curved path.

Parametric equations and their graphs

Consider the orbit of Earth around the Sun. Our year lasts approximately 365.25 days, but for this discussion we will use 365 days. On January 1 of each year, the physical location of Earth with respect to the Sun is nearly the same, except for leap years, when the lag introduced by the extra 1 4 day of orbiting time is built into the calendar. We call January 1 “day 1” of the year. Then, for example, day 31 is January 31, day 59 is February 28, and so on.

The number of the day in a year can be considered a variable that determines Earth’s position in its orbit. As Earth revolves around the Sun, its physical location changes relative to the Sun. After one full year, we are back where we started, and a new year begins. According to Kepler’s laws of planetary motion, the shape of the orbit is elliptical, with the Sun at one focus of the ellipse. We study this idea in more detail in Conic Sections .

An ellipse with January 1 (t = 1) at the top, April 2 (t = 92) on the left, July 1 (t = 182) on the bottom, and October 1 (t = 274) on the right. The focal points of the ellipse have F2 on the left and the Sun on the right.
Earth’s orbit around the Sun in one year.

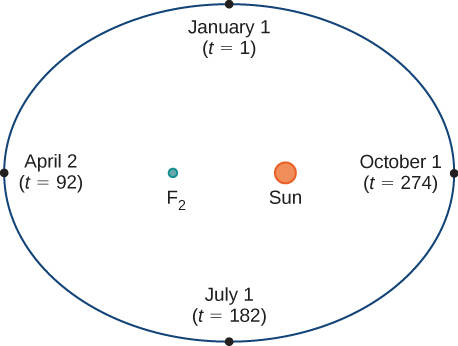
[link] depicts Earth’s orbit around the Sun during one year. The point labeled F 2 is one of the foci of the ellipse; the other focus is occupied by the Sun. If we superimpose coordinate axes over this graph, then we can assign ordered pairs to each point on the ellipse ( [link] ). Then each x value on the graph is a value of position as a function of time, and each y value is also a value of position as a function of time. Therefore, each point on the graph corresponds to a value of Earth’s position as a function of time.
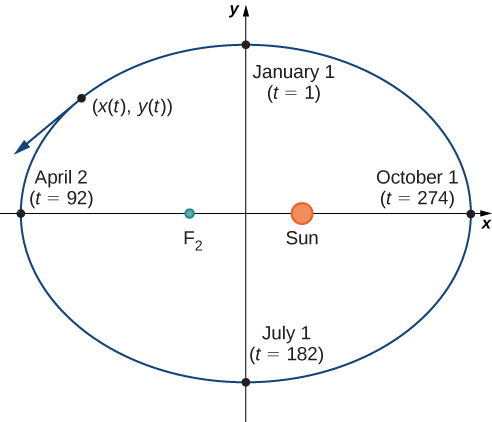
An ellipse with January 1 (t = 1) at the top, April 2 (t = 92) on the left, July 1 (t = 182) on the bottom, and October 1 (t = 274) on the right. The focal points of the ellipse have F2 on the left and the Sun on the right. There is a line going from t = 1 to t = 182. There is also a line going from t = 92 to t = 274 that passes through F2 and the Sun. On the upper left side, there is a point marked (x(t), y(t)) with a tangent line pointing down and to the left.
Coordinate axes superimposed on the orbit of Earth.

We can determine the functions for x ( t ) and y ( t ) , thereby parameterizing the orbit of Earth around the Sun. The variable t is called an independent parameter and, in this context, represents time relative to the beginning of each year.

A curve in the ( x , y ) plane can be represented parametrically. The equations that are used to define the curve are called parametric equations    .

Definition

If x and y are continuous functions of t on an interval I , then the equations

x = x ( t ) and y = y ( t )

are called parametric equations and t is called the parameter    . The set of points ( x , y ) obtained as t varies over the interval I is called the graph of the parametric equations. The graph of parametric equations is called a parametric curve    or plane curve , and is denoted by C .

Questions & Answers

differentiate between demand and supply giving examples
Lambiv Reply
differentiated between demand and supply using examples
Lambiv
what is labour ?
Lambiv
how will I do?
Venny Reply
how is the graph works?I don't fully understand
Rezat Reply
information
Eliyee
devaluation
Eliyee
t
WARKISA
hi guys good evening to all
Lambiv
multiple choice question
Aster Reply
appreciation
Eliyee
explain perfect market
Lindiwe Reply
In economics, a perfect market refers to a theoretical construct where all participants have perfect information, goods are homogenous, there are no barriers to entry or exit, and prices are determined solely by supply and demand. It's an idealized model used for analysis,
Ezea
What is ceteris paribus?
Shukri Reply
other things being equal
AI-Robot
When MP₁ becomes negative, TP start to decline. Extuples Suppose that the short-run production function of certain cut-flower firm is given by: Q=4KL-0.6K2 - 0.112 • Where is quantity of cut flower produced, I is labour input and K is fixed capital input (K-5). Determine the average product of lab
Kelo
Extuples Suppose that the short-run production function of certain cut-flower firm is given by: Q=4KL-0.6K2 - 0.112 • Where is quantity of cut flower produced, I is labour input and K is fixed capital input (K-5). Determine the average product of labour (APL) and marginal product of labour (MPL)
Kelo
yes,thank you
Shukri
Can I ask you other question?
Shukri
what is monopoly mean?
Habtamu Reply
What is different between quantity demand and demand?
Shukri Reply
Quantity demanded refers to the specific amount of a good or service that consumers are willing and able to purchase at a give price and within a specific time period. Demand, on the other hand, is a broader concept that encompasses the entire relationship between price and quantity demanded
Ezea
ok
Shukri
how do you save a country economic situation when it's falling apart
Lilia Reply
what is the difference between economic growth and development
Fiker Reply
Economic growth as an increase in the production and consumption of goods and services within an economy.but Economic development as a broader concept that encompasses not only economic growth but also social & human well being.
Shukri
production function means
Jabir
What do you think is more important to focus on when considering inequality ?
Abdisa Reply
any question about economics?
Awais Reply
sir...I just want to ask one question... Define the term contract curve? if you are free please help me to find this answer 🙏
Asui
it is a curve that we get after connecting the pareto optimal combinations of two consumers after their mutually beneficial trade offs
Awais
thank you so much 👍 sir
Asui
In economics, the contract curve refers to the set of points in an Edgeworth box diagram where both parties involved in a trade cannot be made better off without making one of them worse off. It represents the Pareto efficient allocations of goods between two individuals or entities, where neither p
Cornelius
In economics, the contract curve refers to the set of points in an Edgeworth box diagram where both parties involved in a trade cannot be made better off without making one of them worse off. It represents the Pareto efficient allocations of goods between two individuals or entities,
Cornelius
Suppose a consumer consuming two commodities X and Y has The following utility function u=X0.4 Y0.6. If the price of the X and Y are 2 and 3 respectively and income Constraint is birr 50. A,Calculate quantities of x and y which maximize utility. B,Calculate value of Lagrange multiplier. C,Calculate quantities of X and Y consumed with a given price. D,alculate optimum level of output .
Feyisa Reply
Answer
Feyisa
c
Jabir
the market for lemon has 10 potential consumers, each having an individual demand curve p=101-10Qi, where p is price in dollar's per cup and Qi is the number of cups demanded per week by the i th consumer.Find the market demand curve using algebra. Draw an individual demand curve and the market dema
Gsbwnw Reply
suppose the production function is given by ( L, K)=L¼K¾.assuming capital is fixed find APL and MPL. consider the following short run production function:Q=6L²-0.4L³ a) find the value of L that maximizes output b)find the value of L that maximizes marginal product
Abdureman
types of unemployment
Yomi Reply
What is the difference between perfect competition and monopolistic competition?
Mohammed
Got questions? Join the online conversation and get instant answers!
Jobilize.com Reply
Practice Key Terms 7

Get Jobilize Job Search Mobile App in your pocket Now!

Get it on Google Play Download on the App Store Now


Source:  OpenStax, Calculus volume 3. OpenStax CNX. Feb 05, 2016 Download for free at http://legacy.cnx.org/content/col11966/1.2
Google Play and the Google Play logo are trademarks of Google Inc.

Notification Switch

Would you like to follow the 'Calculus volume 3' conversation and receive update notifications?

Ask