

| << Chapter < Page | Chapter >> Page > |
The getAngle function tests the signs of the values for opposite and adjacent. If the signs indicate that the angle lies in the second quadrant, thevalue returned from the Math.atan method is corrected to place the angle in thesecond quadrant. The corrected angle is returned by the getAngle function.
A positive opposite/adjacent ratio
Similarly, if the opposite/adjacent ratio is positive, this doesn't necessarily mean that the angle lies in the first quadrant. That positive ratiocould result from a negative opposite value and a negative adjacent value. In that case, the angle would lie in the third quadrant between 180 degrees and 270degrees.
Again, the getAngle function tests the signs of the values for opposite and adjacent. If both values are negative, the value returned from the Math.atanmethod is corrected to place the angle in the third quadrant.
No corrections required...
Finally, if no corrections are required for the quadrant, the getAngle function returns the value returned by the Math.atan method. Note however, thatin all cases, the Math.atan method returns the angle in radians. That value is converted to degrees by the getAngle function and the returned value is indegrees.
Positive and negative angles
As you can see from the results of the test shown in Figure 18 , angles in the first, second, and third quadrants are returned as positive angles in degrees.However, angles in the fourth quadrant are returned as negative angles in degrees.
Figure 2 and Figure 16 show the actual mirror image versions of the images contained in the svg files. Figure 19 and Figure 20 show the same images in their non-mirror-image orientation.
| Figure 19 . Normal image from file Phy1020b1.svg. |
|---|
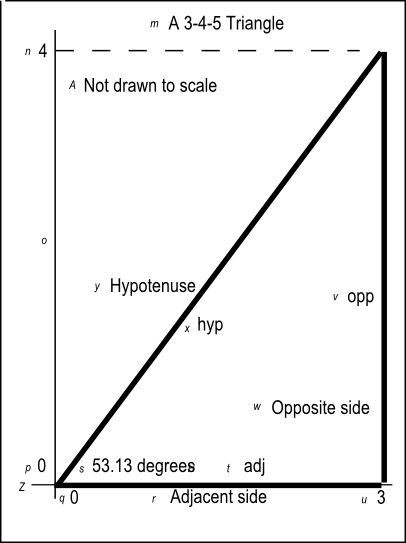 |
| Figure 20 . Normal image plot of cosine and sine curves from the file named Phy1020a1svg. |
|---|
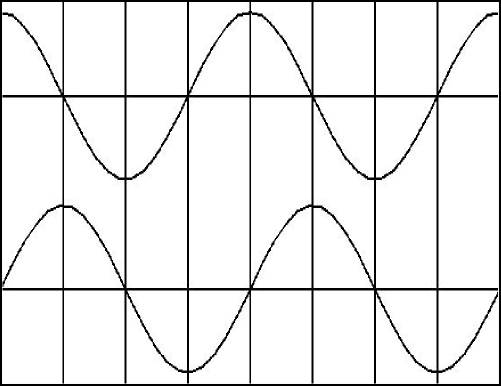 |
I encourage you to run the scripts that I have presented in this lesson to confirm that you get the same results. Copy the code for each script into atext file with an extension of html. Then open that file in your browser. Experiment with the code, making changes, and observing the results of your changes. Makecertain that you can explain why your changes behave as they do.
I will publish a module containing consolidated links to resources on my Connexions web page and will update and add to the list as additional modulesin this collection are published.
This section contains a variety of miscellaneous information.
Financial : Although the openstax CNX site makes it possible for you to download a PDF file for the collection that contains thismodule at no charge, and also makes it possible for you to purchase a pre-printed version of the PDF file, you should beaware that some of the HTML elements in this module may not translate well into PDF.
You also need to know that Prof. Baldwin receives no financial compensation from openstax CNX even if you purchase the PDF version of the collection.
In the past, unknown individuals have copied Prof. Baldwin's modules from cnx.org, converted them to Kindle books, and placed them for sale on Amazon.com showing Prof. Baldwin as the author.Prof. Baldwin neither receives compensation for those sales nor does he know who doesreceive compensation. If you purchase such a book, please be aware that it is a copy of a collection that is freelyavailable on openstax CNX and that it was made and published without the prior knowledge of Prof. Baldwin.
Affiliation : Prof. Baldwin is a professor of Computer Information Technology at Austin Community College in Austin, TX.
-end-
Notification Switch
Would you like to follow the 'Accessible physics concepts for blind students' conversation and receive update notifications?

|
|

|
|

|
|

|
|

|
|

|
|

|
|

|
|

|
|

|