<< Chapter < Page Chapter >> Page >

Wiskunde

Graad 9

Getalpatrone

Grafiese voorstellings

Vergelykings

Statistiek

Waarskynlikheidsleer

Module 13

‘n studie van grafieke

Wat is grafieke nou eintlik?

Aktiwiteit 1

Om sekere grafieke te bestudeer om hulle te kan verstaan

[lu 1.3, 5.5]

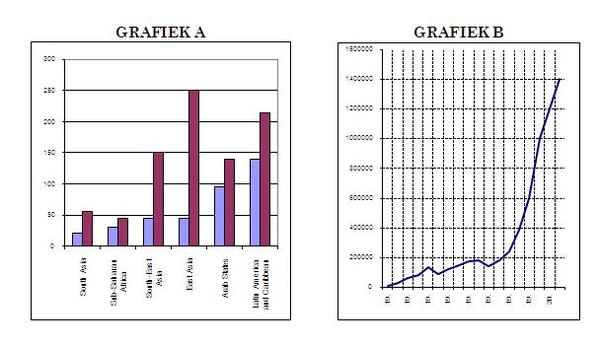
Grafiek A wys hoe die getal TV-stelle per 1 000 mense verander het tussen 1985 en 1995 in ses verskillende streke van die wêreld. Byvoorbeeld, in 1985 het Suid-Asië 20 TV-stelle per 1 000 mense gehad; in 1995 was daar 55 TV-stelle per 1 000 mense.

Grafiek B wys, op die vertikale as, die getal persone in die tronk in die Ver­enigde State van Amerika gedurende die jare aangetoon op die horisontale as. Byvoorbeeld, daar was 135 000 mense in die tronk in 1940.

  • Werk saam in pare; een werk met grafiek A om vraag 1 te beantwoord, en die ander een met grafiek B en vraag 2. Gee redes of verduidelikings vir alle bewerings.

1 Bestudeer grafiek A , en skryf dan antwoorde en verduidelikings neer vir hierdie vrae:

1.1 Watter streek het die laagste getal TV-stelle per 1 000 in 1985 gehad?

1.2 Watter streek het die hoogste getal TV-stelle per 1 000 in 1995 gehad?

1.3 In watter streek het die getal TV-stelle per 1 000 die meeste gestyg?

1.4 Is daar ’n streek waar die getal TV-stelle per 1 000 minder geword het?

1.5 Vergelyk Afrika Suid van die Sahara met die Arabiese State en lewer kommentaar op die verandering in TV-stel-getalle.

1.6 Gebruik nou jou verbeelding – hoe sou die situasie wees? – en trek ’n soortgely­ke grafiek wat twee ander streke wys: Suid-Afrika en die Verenigde State van Amerika.

2 Bestudeer grafiek B en beantwoord hierdie vrae:

2.1 Vanuit die grafiek, probeer skat hoeveel mense in die tronk was in:

a) 1930 b) 1950 c) 1995

2.2 Was daar in 1980 meer of minder as 200 000 mense in die tronk?

2.3 Die grafiek gaan afwaarts net ná 1940. Wat kan jy daaruit aflei?

2.4 Skryf neer rofweg hoeveel jaar dit geneem het vir die tronkbevolking om te verdubbel van wat dit in 1950 was.

2.5 Hoe lank het die tronkbevolking geneem om te verdubbel van wat dit in 1985 was?

2.6 Sou jy sê dat die getal mense in die tronk in die VSA pal styg? Gee redes.

2.7 As ’n mens die grafiek se boodskap lees, hoe meen jy sal die tronkbevolking van die VSA in die toekoms daar uitsien?

3 In Aardrykskunde tref ’n mens ’n interessante soort grafiek aan – ’n deursnee-tekening. Hier sien ’n mens hoe die hoogte bo seespieël varieer tussen twee plekke. Die een hieronder is vir die reguit lyn tussen Bottelaryberg en Papegaaiberg, twee heuwels naby Stellenbosch. Al die mates is in meter. Hieruit kan ons sien dat Bottelaryberg (links) ongeveer 470 m bo seespieël is, en Papegaaiberg ongeveer 255 m. As jy vanaf Bottelaryberg in ’n reguit lyn loop, kry jy ná ongeveer 2,5 km ’n holtetjie, en dan, oor nog ’n halwe kilometer, loop jy oor ’n klein heuweltjie.

  • So ’n grafiek is van besondere waarde vir padmakers aangesien dit die skuinsste van die terrein aantoon.
  • Dit is baie duidelik dat vanaf Bottelaryberg die hoogte sterk val oor ongeveer 750 m. Maar as jy van die kruin van Papegaaiberg af in die rigting van Bottelaryberg stap, neem dit die hoogte omtrent 1,5 km om net so ver te val, wat die roete heelwat minder steil maak.

Questions & Answers

differentiate between demand and supply giving examples
Lambiv Reply
differentiated between demand and supply using examples
Lambiv
what is labour ?
Lambiv
how will I do?
Venny Reply
how is the graph works?I don't fully understand
Rezat Reply
information
Eliyee
devaluation
Eliyee
t
WARKISA
hi guys good evening to all
Lambiv
multiple choice question
Aster Reply
appreciation
Eliyee
explain perfect market
Lindiwe Reply
In economics, a perfect market refers to a theoretical construct where all participants have perfect information, goods are homogenous, there are no barriers to entry or exit, and prices are determined solely by supply and demand. It's an idealized model used for analysis,
Ezea
What is ceteris paribus?
Shukri Reply
other things being equal
AI-Robot
When MP₁ becomes negative, TP start to decline. Extuples Suppose that the short-run production function of certain cut-flower firm is given by: Q=4KL-0.6K2 - 0.112 • Where is quantity of cut flower produced, I is labour input and K is fixed capital input (K-5). Determine the average product of lab
Kelo
Extuples Suppose that the short-run production function of certain cut-flower firm is given by: Q=4KL-0.6K2 - 0.112 • Where is quantity of cut flower produced, I is labour input and K is fixed capital input (K-5). Determine the average product of labour (APL) and marginal product of labour (MPL)
Kelo
yes,thank you
Shukri
Can I ask you other question?
Shukri
what is monopoly mean?
Habtamu Reply
What is different between quantity demand and demand?
Shukri Reply
Quantity demanded refers to the specific amount of a good or service that consumers are willing and able to purchase at a give price and within a specific time period. Demand, on the other hand, is a broader concept that encompasses the entire relationship between price and quantity demanded
Ezea
ok
Shukri
how do you save a country economic situation when it's falling apart
Lilia Reply
what is the difference between economic growth and development
Fiker Reply
Economic growth as an increase in the production and consumption of goods and services within an economy.but Economic development as a broader concept that encompasses not only economic growth but also social & human well being.
Shukri
production function means
Jabir
What do you think is more important to focus on when considering inequality ?
Abdisa Reply
any question about economics?
Awais Reply
sir...I just want to ask one question... Define the term contract curve? if you are free please help me to find this answer 🙏
Asui
it is a curve that we get after connecting the pareto optimal combinations of two consumers after their mutually beneficial trade offs
Awais
thank you so much 👍 sir
Asui
In economics, the contract curve refers to the set of points in an Edgeworth box diagram where both parties involved in a trade cannot be made better off without making one of them worse off. It represents the Pareto efficient allocations of goods between two individuals or entities, where neither p
Cornelius
In economics, the contract curve refers to the set of points in an Edgeworth box diagram where both parties involved in a trade cannot be made better off without making one of them worse off. It represents the Pareto efficient allocations of goods between two individuals or entities,
Cornelius
Suppose a consumer consuming two commodities X and Y has The following utility function u=X0.4 Y0.6. If the price of the X and Y are 2 and 3 respectively and income Constraint is birr 50. A,Calculate quantities of x and y which maximize utility. B,Calculate value of Lagrange multiplier. C,Calculate quantities of X and Y consumed with a given price. D,alculate optimum level of output .
Feyisa Reply
Answer
Feyisa
c
Jabir
the market for lemon has 10 potential consumers, each having an individual demand curve p=101-10Qi, where p is price in dollar's per cup and Qi is the number of cups demanded per week by the i th consumer.Find the market demand curve using algebra. Draw an individual demand curve and the market dema
Gsbwnw Reply
suppose the production function is given by ( L, K)=L¼K¾.assuming capital is fixed find APL and MPL. consider the following short run production function:Q=6L²-0.4L³ a) find the value of L that maximizes output b)find the value of L that maximizes marginal product
Abdureman
types of unemployment
Yomi Reply
What is the difference between perfect competition and monopolistic competition?
Mohammed
Got questions? Join the online conversation and get instant answers!
Jobilize.com Reply

Get Jobilize Job Search Mobile App in your pocket Now!

Get it on Google Play Download on the App Store Now


Source:  OpenStax, Wiskunde graad 9. OpenStax CNX. Sep 14, 2009 Download for free at http://cnx.org/content/col11055/1.1
Google Play and the Google Play logo are trademarks of Google Inc.

Notification Switch

Would you like to follow the 'Wiskunde graad 9' conversation and receive update notifications?

Ask