<< Chapter < Page Chapter >> Page >

Experiment : motion at constant velocity

Aim:

To measure the position and time during motion at constant velocity and determine the average velocity as the gradient of a “Position vs. Time" graph.

Apparatus:

A battery operated toy car, stopwatch, meter stick or measuring tape.

Method

  1. Work with a friend. Copy the table below into your workbook.
  2. Complete the table by timing the car as it travels each distance.
  3. Time the car twice for each distance and take the average value as your accepted time.
  4. Use the distance and average time values to plot a graph of “Distance vs. Time" onto graph paper . Stick the graph paper into your workbook. (Remember that “A vs. B" always means “y vs. x").
  5. Insert all axis labels and units onto your graph.
  6. Draw the best straight line through your data points.
  7. Find the gradient of the straight line. This is the average velocity.

Results:

Distance (m) Time (s)
1 2 Ave.
0
0,5
1,0
1,5
2,0
2,5
3,0

Conclusions:

Answer the following questions in your workbook:
  1. Did the car travel with a constant velocity?
  2. How can you tell by looking at the “Distance vs. Time" graph if the velocity is constant?
  3. How would the “Distance vs. Time" look for a car with a faster velocity?
  4. How would the “Distance vs. Time" look for a car with a slower velocity?

Motion at constant acceleration

The final situation we will be studying is motion at constant acceleration. We know that acceleration is the rate of change of velocity. So, if we have a constant acceleration, this means that the velocity changes at a constant rate.

Let's look at our first example of Lesedi waiting at the taxi stop again. A taxi arrived and Lesedi got in. The taxi stopped at the stop street and then accelerated as follows: After 1 s the taxi covered a distance of 2,5 m , after 2 s it covered 10 m , after 3 s it covered 22,5 m and after 4 s it covered 40 m . The taxi is covering a larger distance every second. This means that it is accelerating.

To calculate the velocity of the taxi you need to calculate the gradient of the line at each second:

v 1 s = Δ x Δ t = x f - x i t f - t i = 5 m - 0 m 1 , 5 s - 0 , 5 s = 5 m · s - 1
v 2 s = Δ x Δ t = x f - x i t f - t i = 15 m - 5 m 2 , 5 s - 1 , 5 s = 10 m · s - 1
v 3 s = Δ x Δ t = x f - x i t f - t i = 30 m - 15 m 3 , 5 s - 2 , 5 s = 15 m · s - 1

From these velocities, we can draw the velocity-time graph which forms a straight line.

The acceleration is the gradient of the v vs. t graph and can be calculated as follows:

a = Δ v Δ t = v f - v i t f - t i = 15 m · s - 1 - 5 m · s - 1 3 s - 1 s = 5 m · s - 2

The acceleration does not change during the motion (the gradient stays constant). This is motion at constant or uniform acceleration.

The graphs for this situation are shown in [link] .

Graphs for motion with a constant acceleration (a) position vs. time (b) velocity vs. time (c) acceleration vs. time.

Velocity from acceleration vs. time graphs

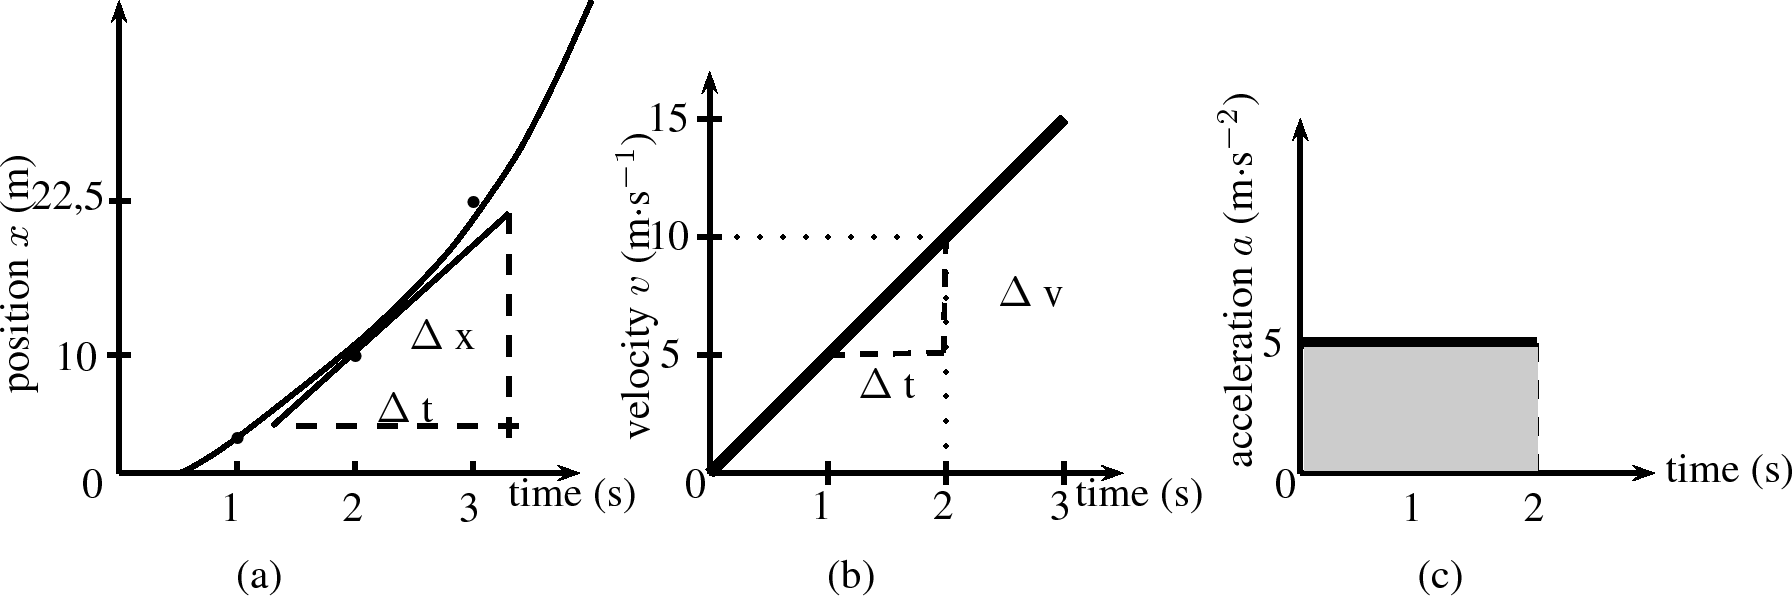
Just as we used velocity vs. time graphs to find displacement, we can use acceleration vs. time graphs to find the velocity of an object at a given moment in time. We simply calculate the area under the acceleration vs. time graph, at a given time. In the graph below, showing an object at a constant positive acceleration, the increase in velocity of the object after 2 seconds corresponds to the shaded portion.

Questions & Answers

What are the factors that affect demand for a commodity
Florence Reply
differentiate between demand and supply giving examples
Lambiv Reply
differentiated between demand and supply using examples
Lambiv
what is labour ?
Lambiv
how will I do?
Venny Reply
how is the graph works?I don't fully understand
Rezat Reply
information
Eliyee
devaluation
Eliyee
t
WARKISA
hi guys good evening to all
Lambiv
multiple choice question
Aster Reply
appreciation
Eliyee
explain perfect market
Lindiwe Reply
In economics, a perfect market refers to a theoretical construct where all participants have perfect information, goods are homogenous, there are no barriers to entry or exit, and prices are determined solely by supply and demand. It's an idealized model used for analysis,
Ezea
What is ceteris paribus?
Shukri Reply
other things being equal
AI-Robot
When MP₁ becomes negative, TP start to decline. Extuples Suppose that the short-run production function of certain cut-flower firm is given by: Q=4KL-0.6K2 - 0.112 • Where is quantity of cut flower produced, I is labour input and K is fixed capital input (K-5). Determine the average product of lab
Kelo
Extuples Suppose that the short-run production function of certain cut-flower firm is given by: Q=4KL-0.6K2 - 0.112 • Where is quantity of cut flower produced, I is labour input and K is fixed capital input (K-5). Determine the average product of labour (APL) and marginal product of labour (MPL)
Kelo
yes,thank you
Shukri
Can I ask you other question?
Shukri
what is monopoly mean?
Habtamu Reply
What is different between quantity demand and demand?
Shukri Reply
Quantity demanded refers to the specific amount of a good or service that consumers are willing and able to purchase at a give price and within a specific time period. Demand, on the other hand, is a broader concept that encompasses the entire relationship between price and quantity demanded
Ezea
ok
Shukri
how do you save a country economic situation when it's falling apart
Lilia Reply
what is the difference between economic growth and development
Fiker Reply
Economic growth as an increase in the production and consumption of goods and services within an economy.but Economic development as a broader concept that encompasses not only economic growth but also social & human well being.
Shukri
production function means
Jabir
What do you think is more important to focus on when considering inequality ?
Abdisa Reply
any question about economics?
Awais Reply
sir...I just want to ask one question... Define the term contract curve? if you are free please help me to find this answer 🙏
Asui
it is a curve that we get after connecting the pareto optimal combinations of two consumers after their mutually beneficial trade offs
Awais
thank you so much 👍 sir
Asui
In economics, the contract curve refers to the set of points in an Edgeworth box diagram where both parties involved in a trade cannot be made better off without making one of them worse off. It represents the Pareto efficient allocations of goods between two individuals or entities, where neither p
Cornelius
In economics, the contract curve refers to the set of points in an Edgeworth box diagram where both parties involved in a trade cannot be made better off without making one of them worse off. It represents the Pareto efficient allocations of goods between two individuals or entities,
Cornelius
Suppose a consumer consuming two commodities X and Y has The following utility function u=X0.4 Y0.6. If the price of the X and Y are 2 and 3 respectively and income Constraint is birr 50. A,Calculate quantities of x and y which maximize utility. B,Calculate value of Lagrange multiplier. C,Calculate quantities of X and Y consumed with a given price. D,alculate optimum level of output .
Feyisa Reply
Answer
Feyisa
c
Jabir
the market for lemon has 10 potential consumers, each having an individual demand curve p=101-10Qi, where p is price in dollar's per cup and Qi is the number of cups demanded per week by the i th consumer.Find the market demand curve using algebra. Draw an individual demand curve and the market dema
Gsbwnw Reply
suppose the production function is given by ( L, K)=L¼K¾.assuming capital is fixed find APL and MPL. consider the following short run production function:Q=6L²-0.4L³ a) find the value of L that maximizes output b)find the value of L that maximizes marginal product
Abdureman
Got questions? Join the online conversation and get instant answers!
Jobilize.com Reply

Get Jobilize Job Search Mobile App in your pocket Now!

Get it on Google Play Download on the App Store Now


Source:  OpenStax, Siyavula textbooks: grade 10 physical science [caps]. OpenStax CNX. Sep 30, 2011 Download for free at http://cnx.org/content/col11305/1.7
Google Play and the Google Play logo are trademarks of Google Inc.

Notification Switch

Would you like to follow the 'Siyavula textbooks: grade 10 physical science [caps]' conversation and receive update notifications?

Ask