<< Chapter < Page Chapter >> Page >

Geography

Grade 4

Map work

Map symbols

Module 5

A large area is usually shown in a small picture on a map. Numbers, letters and pictures are then used to indicate rivers, roads, railway lines, buildings, etc. They are called map symbols. To explain the symbols on a map, a symbol key is used.

1.the plan (map) of my classroom

Tom has drawn a map (plan) of his classroom:

Tom’s classroom

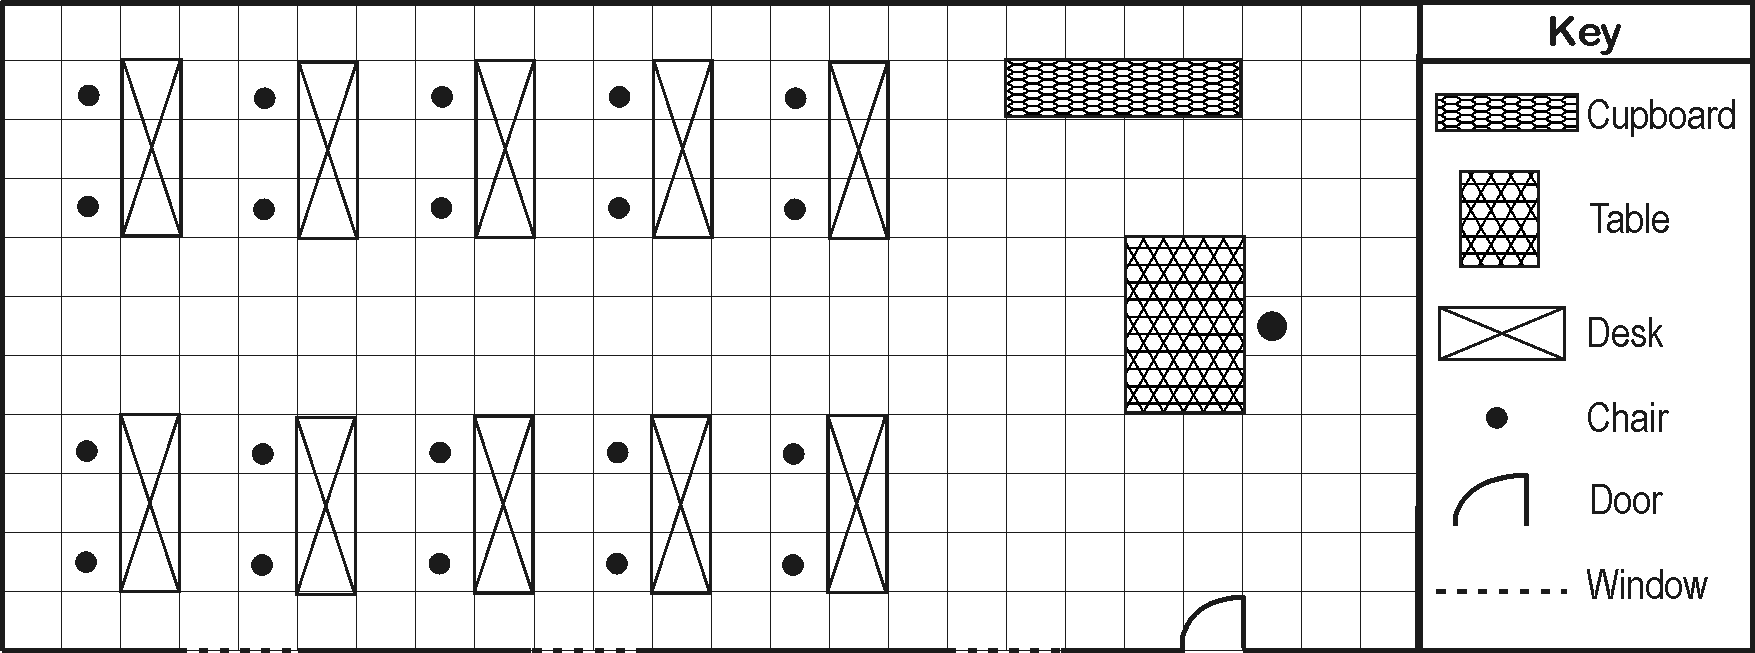
Scale: 1 square = 1 step

The classroom was too big to be drawn on a sheet of paper, and TOM had to REDUCE the classroom. For each step that he took, he used one square on the paper. The tables and other items were also reduced in the same way.

Activity 1

To draw a plan of the classroom [lo 1.3]

Use the symbol key given and draw a plan of your classroom as you think it will look from the air. You can add to the key if you want to. You can use colour, but work in pencil first to plan it. Use one step for each square. Work on your own.

My classroom

Key

That looks very nice!

Your educator will now give you a plan of your classroom that he/she has drawn up.

Activity 2

To compare two plans with one another [lo 1.3]

1. Compare your educator’s plan with the one that you drew for your classroom. Check to see where you made mistakes.

2. Measure the length of the classroom in steps. It is steps long.

3. Measure the width of the classroom in steps. It is steps wide.

  1. Colour your desk red.
  2. Draw the shortest route to the door of the classroom with a red arrow.

2.a plan of the school grounds

  • Today we are going to study a bigger plan. We are going to represent the ENTIRE SCHOOL GROUNDS on a plan (map).
  • However, we must first do FIELDWORK to gather all the knowledge required.

Activity 3

To represent the school grounds on a plan [lo 1.4]

Take a piece of paper and a pencil with you to make notes and sketches of everything you see. Look carefully at the following:

1. The location and shape of the school building.

2. The location and shape of other buildings on the school grounds.

3. The location and shape of the sports fields.

4. The location and shape of the playing fields.

5. The location and shape of the flower gardens.

6. The location of the main entrance gate.

7. The names of the streets on all sides of the school grounds.

8. Make sure where the four main directions are located.

Back in the classroom

Your educator will now hand out a completed plan of the school grounds:

1. Turn your desks so that you all face NORTH.

2. Study the plan of the school grounds carefully and decide where the four main directions are. Indicate these on the plan.

3. Study the plan of the school grounds carefully and compare it with your notes. Do you agree with the location of the buildings and other objects?

4. Use the key to your plan and colour in the plan accordingly: Example: school buildings – red sports fields - green

5. If you have a problem, your educator can take you outside again to make sure of your facts.

6. Indicate the route from your classroom to the principal’s office with a red arrow.

7. In what direction does the front door of your school face?

8. Write down the names of the various streets around the school in the correct places on the plan.

3. Our immediate surroundings

  • This is a street plan of a portion of Cape Town

Activity 4

To read a street plan [lo 1.5]

1. Why do we need a street plan of a city?

……………………………………………………………………………………….

……………………………………………………………………………………….

2. In what direction does building A lie from building C?

……………………………………………………………………………………….

3. Use red to indicate the shortest route from point C to point D on the map (take one-way streets into consideration).

4. You are standing on the corner of Loop and Leeuwen Streets. Explain to a tourist how to get from that position to point D.

………………………………………………………………………………………

………………………………………………………………………………………

………………………………………………………………………………………

Your educator will later give you a map just like this one of your own environment. However, today we are first going to do FIELDWORK again in our own environment.

Your educator will now give each of you a map of your immediate environment. Answer the following questions (note the key to the map):

1. Find your school on the street plan and colour it in.

2. Find your own home, or that of someone you know well, on the map. Colour it in with a different colour.

3. Indicate the route that you followed on your fieldwork outing on the map.

4. Which street is south of your school? ……………………………….

5. Indicate on your own map the important buildings and other features that your educator pointed out during the outing.

Assessment

Learning outcome 1: geographical enquiry

The learner will be able to use enquiry skills to investigate geographical and

environmental concepts and processes.

Assessment standard

We know this when the learner:

1.3 identifies symbols used in different kinds of maps (including plan view, grids and map keys) [works with sources].

1.4 locates places using a simple grid referencing system and directions [works with sources];

1.5 identifies important political boundaries and key human and physical features on large-scale maps [works with sources].

Memorandum

  1. Not to get lost

To find places

To find the shortest routes

  1. S

4. 2 blocks east (in Leeuwen)

2 blocks south

Questions & Answers

differentiate between demand and supply giving examples
Lambiv Reply
differentiated between demand and supply using examples
Lambiv
what is labour ?
Lambiv
how will I do?
Venny Reply
how is the graph works?I don't fully understand
Rezat Reply
information
Eliyee
devaluation
Eliyee
t
WARKISA
hi guys good evening to all
Lambiv
multiple choice question
Aster Reply
appreciation
Eliyee
explain perfect market
Lindiwe Reply
In economics, a perfect market refers to a theoretical construct where all participants have perfect information, goods are homogenous, there are no barriers to entry or exit, and prices are determined solely by supply and demand. It's an idealized model used for analysis,
Ezea
What is ceteris paribus?
Shukri Reply
other things being equal
AI-Robot
When MP₁ becomes negative, TP start to decline. Extuples Suppose that the short-run production function of certain cut-flower firm is given by: Q=4KL-0.6K2 - 0.112 • Where is quantity of cut flower produced, I is labour input and K is fixed capital input (K-5). Determine the average product of lab
Kelo
Extuples Suppose that the short-run production function of certain cut-flower firm is given by: Q=4KL-0.6K2 - 0.112 • Where is quantity of cut flower produced, I is labour input and K is fixed capital input (K-5). Determine the average product of labour (APL) and marginal product of labour (MPL)
Kelo
yes,thank you
Shukri
Can I ask you other question?
Shukri
what is monopoly mean?
Habtamu Reply
What is different between quantity demand and demand?
Shukri Reply
Quantity demanded refers to the specific amount of a good or service that consumers are willing and able to purchase at a give price and within a specific time period. Demand, on the other hand, is a broader concept that encompasses the entire relationship between price and quantity demanded
Ezea
ok
Shukri
how do you save a country economic situation when it's falling apart
Lilia Reply
what is the difference between economic growth and development
Fiker Reply
Economic growth as an increase in the production and consumption of goods and services within an economy.but Economic development as a broader concept that encompasses not only economic growth but also social & human well being.
Shukri
production function means
Jabir
What do you think is more important to focus on when considering inequality ?
Abdisa Reply
any question about economics?
Awais Reply
sir...I just want to ask one question... Define the term contract curve? if you are free please help me to find this answer 🙏
Asui
it is a curve that we get after connecting the pareto optimal combinations of two consumers after their mutually beneficial trade offs
Awais
thank you so much 👍 sir
Asui
In economics, the contract curve refers to the set of points in an Edgeworth box diagram where both parties involved in a trade cannot be made better off without making one of them worse off. It represents the Pareto efficient allocations of goods between two individuals or entities, where neither p
Cornelius
In economics, the contract curve refers to the set of points in an Edgeworth box diagram where both parties involved in a trade cannot be made better off without making one of them worse off. It represents the Pareto efficient allocations of goods between two individuals or entities,
Cornelius
Suppose a consumer consuming two commodities X and Y has The following utility function u=X0.4 Y0.6. If the price of the X and Y are 2 and 3 respectively and income Constraint is birr 50. A,Calculate quantities of x and y which maximize utility. B,Calculate value of Lagrange multiplier. C,Calculate quantities of X and Y consumed with a given price. D,alculate optimum level of output .
Feyisa Reply
Answer
Feyisa
c
Jabir
the market for lemon has 10 potential consumers, each having an individual demand curve p=101-10Qi, where p is price in dollar's per cup and Qi is the number of cups demanded per week by the i th consumer.Find the market demand curve using algebra. Draw an individual demand curve and the market dema
Gsbwnw Reply
suppose the production function is given by ( L, K)=L¼K¾.assuming capital is fixed find APL and MPL. consider the following short run production function:Q=6L²-0.4L³ a) find the value of L that maximizes output b)find the value of L that maximizes marginal product
Abdureman
types of unemployment
Yomi Reply
What is the difference between perfect competition and monopolistic competition?
Mohammed
Got questions? Join the online conversation and get instant answers!
Jobilize.com Reply

Get Jobilize Job Search Mobile App in your pocket Now!

Get it on Google Play Download on the App Store Now


Source:  OpenStax, Geography grade 4. OpenStax CNX. Sep 17, 2009 Download for free at http://cnx.org/content/col11084/1.1
Google Play and the Google Play logo are trademarks of Google Inc.

Notification Switch

Would you like to follow the 'Geography grade 4' conversation and receive update notifications?

Ask