<< Chapter < Page
  Digital signal processing - dsp     Page 8 / 14
Chapter >> Page >

The complexToComplex method can be used to perform either a forward or an inverse transform. The value of the first parameter determineswhether the method performs a forward or an inverse Fourier transform.

The first parameter of the complextocomplex method

A value of +1 for the first parameter causes the complexToComplex method to perform a forward Fourier transform.

A value of -1 for the first parameter causes the complexToComplex method to perform an inverse Fourier transform.

The forward transform

Although I didn't include the code in this module, (because it was shown in an earlier module) , the transform method in Figure 7 passes a value of +1 to the complexToComplex method to cause it to perform a forward Fourier transform.

The inverse transform

Similarly, the inverseTransform method shown in Listing 17 passes a value of -1 to the complexToComplex method to cause it to perform an inverse Fourier transform.

Fft and dft produce equivalent results

As evidenced in Figure 1 and Figure 2 , the program named Dsp035 , which uses a DFT algorithm, produces the same results as the program named Dsp036 , which uses an FFT algorithm. However, if you were to put a timer on each of the programs, you would find that Dsp036 runs faster due to the improved speed of the FFT algorithm over the DFTalgorithm.

Using a Fourier transform to perform frequency filtering

The program named Dsp037 illustrates frequency filtering accomplished by modifying the complex spectrum in the frequency domain and thenperforming an inverse Fourier transform on the modified frequency-domain data. The results are shown in Figure 4 .

Figure 4. Filtering in the frequency domain.
missing image

Operation of the program

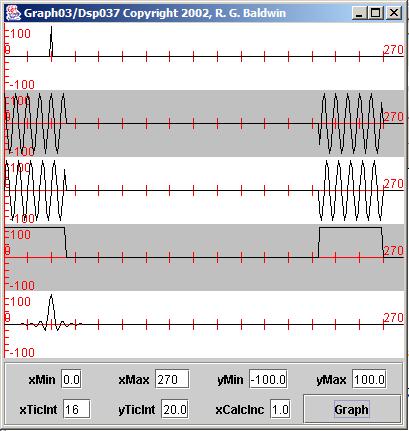
The program begins by using an FFT algorithm to perform a forward Fourier transform on a single impulse in the time domain.

(A DFT algorithm could have been used equally as well, but it would have been slower.)

The impulse is shown as the input time series in the topmost plot in Figure 4 .

(Although I didn't show the complex spectrum of the impulse, we know that the magnitude of the spectrum of an impulse is constant across allfrequencies. In other words, the magnitude spectrum of an impulse is a flat line from zero to the sampling frequency and above.)

Modify the complex spectrum

Then the program eliminates all energy between one-sixth and five-sixths of the sampling frequency by setting the real and imaginary parts of the FFT outputto zero.

The second, third, and fourth plots in Figure 4 show the real part, imaginary part, and amplitude respectively of the modified complex spectrum.

(The two boxes in the fourth plot in Figure 4 show what's left of the spectral energy after the energy in the middle of the band has beeneliminated.)

The folding frequency in these three plots is near the center of the plot at the eighth tick mark.

The plotting format

The input data length was 256 samples. All but one of the input data values was set to zero resulting in a single impulse in the input time series near thesecond tick mark in Figure 4 .

Questions & Answers

how do you get the 2/50
Abba Reply
number of sport play by 50 student construct discrete data
Aminu Reply
width of the frangebany leaves on how to write a introduction
Theresa Reply
Solve the mean of variance
Veronica Reply
Step 1: Find the mean. To find the mean, add up all the scores, then divide them by the number of scores. ... Step 2: Find each score's deviation from the mean. ... Step 3: Square each deviation from the mean. ... Step 4: Find the sum of squares. ... Step 5: Divide the sum of squares by n – 1 or N.
kenneth
what is error
Yakuba Reply
Is mistake done to something
Vutshila
Hy
anas
hy
What is the life teble
anas
hy
Jibrin
statistics is the analyzing of data
Tajudeen Reply
what is statics?
Zelalem Reply
how do you calculate mean
Gloria Reply
diveving the sum if all values
Shaynaynay
let A1,A2 and A3 events be independent,show that (A1)^c, (A2)^c and (A3)^c are independent?
Fisaye Reply
what is statistics
Akhisani Reply
data collected all over the world
Shaynaynay
construct a less than and more than table
Imad Reply
The sample of 16 students is taken. The average age in the sample was 22 years with astandard deviation of 6 years. Construct a 95% confidence interval for the age of the population.
Aschalew Reply
Bhartdarshan' is an internet-based travel agency wherein customer can see videos of the cities they plant to visit. The number of hits daily is a normally distributed random variable with a mean of 10,000 and a standard deviation of 2,400 a. what is the probability of getting more than 12,000 hits? b. what is the probability of getting fewer than 9,000 hits?
Akshay Reply
Bhartdarshan'is an internet-based travel agency wherein customer can see videos of the cities they plan to visit. The number of hits daily is a normally distributed random variable with a mean of 10,000 and a standard deviation of 2,400. a. What is the probability of getting more than 12,000 hits
Akshay
1
Bright
Sorry i want to learn more about this question
Bright
Someone help
Bright
a= 0.20233 b=0.3384
Sufiyan
a
Shaynaynay
How do I interpret level of significance?
Mohd Reply
It depends on your business problem or in Machine Learning you could use ROC- AUC cruve to decide the threshold value
Shivam
how skewness and kurtosis are used in statistics
Owen Reply
yes what is it
Taneeya
Got questions? Join the online conversation and get instant answers!
Jobilize.com Reply

Get Jobilize Job Search Mobile App in your pocket Now!

Get it on Google Play Download on the App Store Now


Source:  OpenStax, Digital signal processing - dsp. OpenStax CNX. Jan 06, 2016 Download for free at https://legacy.cnx.org/content/col11642/1.38
Google Play and the Google Play logo are trademarks of Google Inc.

Notification Switch

Would you like to follow the 'Digital signal processing - dsp' conversation and receive update notifications?

Ask