<< Chapter < Page Chapter >> Page >
g ( z ) = 1 1 + e - z

Sigmoid function

sigmoid
Sigmoid function for X in [-10,10]

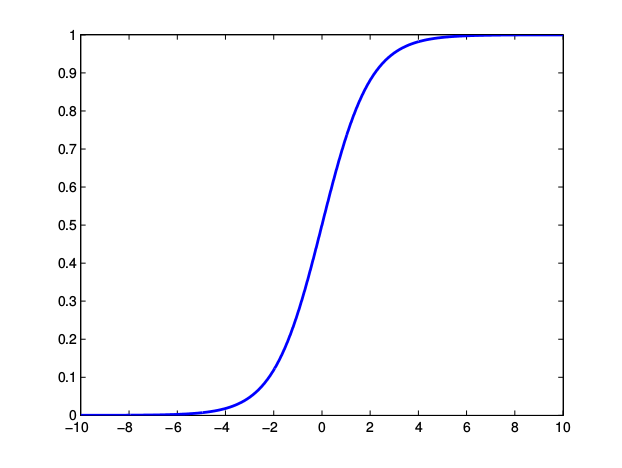
Why might we want to do this? If we are doing classification between two different items, where one set of examples has the value 0 and one has the value 1, it doesn't make much sense to have values that are outside of this range. With linear regression, the predictions can take on any value. In order to model our hypothesis as being contained within the 0 to 1 range, we can use the sigmoid function. Using the Generalized Linear Model,

J ( θ ) = 1 2 m i = 1 m ( h θ ( x i ) - y i ) 2

Recall that in linear regression the hypothesis is

h θ ( x ) = θ T x

In logistic regression, the hypothesis function is

h θ ( x ) = g ( θ T x ) = 1 1 + e - θ T x

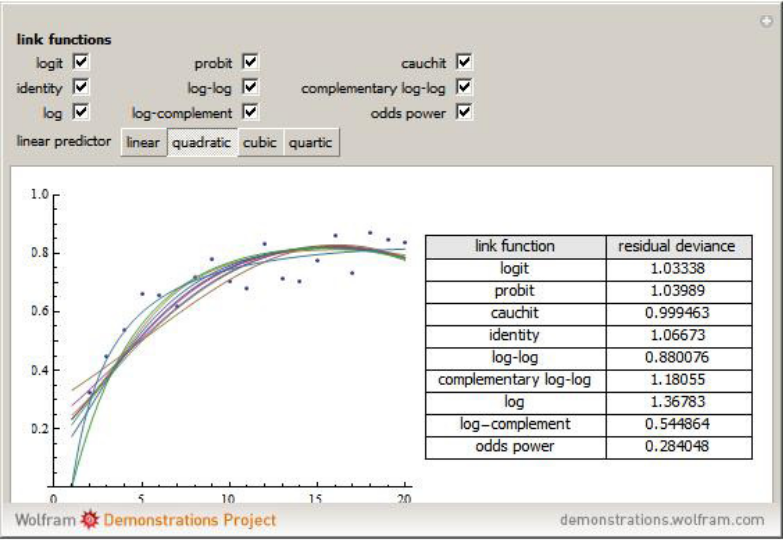
Wolfram demonstrations logit function

popup
http://demonstrations.wolfram.com/ComparingBinomialGeneralizedLinearModels/

Probabilistic interpretation

What we are essentially doing with taking least-squares regression is fitting our data, but we can go about classifying by describing the probability boundary that one of our points is above and below a line, and finding the maximum likelihood estimate of a given theta.

If we define the Probabilities of being defined as class 1 or 0 as

P ( y = 1 | θ ) = h θ ( x ) P ( y = 0 | θ ) = 1 - h θ ( x )

Then it becomes clear that the likelihoods are described as the following:

L ( θ ) = i = 1 m ( h θ ( x i ) ) y i ( 1 - h θ ( x i ) ) 1 - y i

From statistics, it is well-known that taking the log of a maximum likelihood estimate will still achieve the same maximum, and calculating the log-likelihood is significantly easier from a computational standpoint. For a proof of this, see here .

We therefore take the log of the above cost function as a log-likelihood and obtain:

l ( θ ) = i = 1 m ( y i l o g ( h θ ( x i ) ) + ( 1 - y i ) l o g ( 1 - h θ ( x i ) ) )

Minimizing the cost function

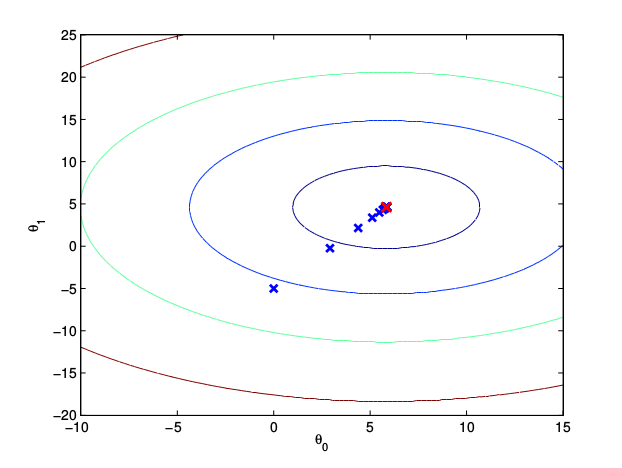
Now that we understand how we would classify these datasets exactly, how do we minimize the cost function? One simple way involves the application of Gradient Descent.

Gradient Descent is a method of approximating a cost function that gets you to converge to a final correct value. This is described for our cost function above as

θ j = θ j - α θ j J ( θ )

That is, for every example, we update the theta value by subtracting (subject to some learning rate parameter α ) the partial derivative of the cost function in terms of that example, and repeat until convergence.

If we plot the output of a gradient descent function, it will start at a random point on the contour plot, and then after every iteration, it will move closer to the optimal value.

Gradient descent

grad
Gradient Descent plot showing the trend towards the optimum value

Applying logistic regression

In this section, we apply logistic regression described in earlier section to a simulated data set and study how well it performs.

Data generation

We simulated the case where each training example is described by two features x 1 and x 2 . The two features x 1 and x 2 are generated uniformly in the range [ 0 , 10 ] . The size of the training data set is 1000. The training examples were split into 2 classes, class 0 or class 1 based on the polynomial:

x 1 - 5 4 - x 2 3 + 6 = 0

All the training examples that are above the polynomial eq.  [link] belong to class 1 and the training examples below the polynomial curve belong to class 0. Notice that the true boundary that separates the two classes is a 4 th order polynomial.

Questions & Answers

Ayele, K., 2003. Introductory Economics, 3rd ed., Addis Ababa.
Widad Reply
can you send the book attached ?
Ariel
?
Ariel
What is economics
Widad Reply
the study of how humans make choices under conditions of scarcity
AI-Robot
U(x,y) = (x×y)1/2 find mu of x for y
Desalegn Reply
U(x,y) = (x×y)1/2 find mu of x for y
Desalegn
what is ecnomics
Jan Reply
this is the study of how the society manages it's scarce resources
Belonwu
what is macroeconomic
John Reply
macroeconomic is the branch of economics which studies actions, scale, activities and behaviour of the aggregate economy as a whole.
husaini
etc
husaini
difference between firm and industry
husaini Reply
what's the difference between a firm and an industry
Abdul
firm is the unit which transform inputs to output where as industry contain combination of firms with similar production 😅😅
Abdulraufu
Suppose the demand function that a firm faces shifted from Qd  120 3P to Qd  90  3P and the supply function has shifted from QS  20  2P to QS 10  2P . a) Find the effect of this change on price and quantity. b) Which of the changes in demand and supply is higher?
Toofiq Reply
explain standard reason why economic is a science
innocent Reply
factors influencing supply
Petrus Reply
what is economic.
Milan Reply
scares means__________________ends resources. unlimited
Jan
economics is a science that studies human behaviour as a relationship b/w ends and scares means which have alternative uses
Jan
calculate the profit maximizing for demand and supply
Zarshad Reply
Why qualify 28 supplies
Milan
what are explicit costs
Nomsa Reply
out-of-pocket costs for a firm, for example, payments for wages and salaries, rent, or materials
AI-Robot
concepts of supply in microeconomics
David Reply
economic overview notes
Amahle Reply
identify a demand and a supply curve
Salome Reply
i don't know
Parul
there's a difference
Aryan
Demand curve shows that how supply and others conditions affect on demand of a particular thing and what percent demand increase whith increase of supply of goods
Israr
Hi Sir please how do u calculate Cross elastic demand and income elastic demand?
Abari
Got questions? Join the online conversation and get instant answers!
Jobilize.com Reply

Get Jobilize Job Search Mobile App in your pocket Now!

Get it on Google Play Download on the App Store Now


Source:  OpenStax, Introductory survey and applications of machine learning methods. OpenStax CNX. Dec 22, 2011 Download for free at http://legacy.cnx.org/content/col11400/1.1
Google Play and the Google Play logo are trademarks of Google Inc.

Notification Switch

Would you like to follow the 'Introductory survey and applications of machine learning methods' conversation and receive update notifications?

Ask