Recent climate change, which has occurred during the modern instrument era, is the focus of this module. It is through the lens of long-term climate change (occurring on thousands to millions of years) that we will view earth’s current climate and recent climate change. The goal is to investigate how the principles listed above are shaping current climate events
Learning objectives
After reading this module, students should be able to
assess long-term global temperature records and place recent climate change into the context of historical temperature observations
explain how changes in the Sun's energy output have impacted the last 1300 years of global temperature records
analyze the human impact on the planetary albedo and relate these changes to recent climate change
predict the response of the global average temperature when large volcanic eruptions occur
explain the enhanced greenhouse effect
discuss how recent observations of change measured within regional ecosystems are related to global climate change
In the past, Earth has been significantly warmer (and mostly ice free) and significantly colder (especially during the so-called “Snowball Earth” eras) than it is today.
Climate change occurs when there are changes in insolation, albedo, and composition of the atmosphere.
Climate is the average of weather, and changes to the earth’s climate occur on long time scales.
Recent climate change, which has occurred during the modern instrument era, is the focus of this module. It is through the lens of long-term climate change (occurring on thousands to millions of years) that we will view earth’s current climate and recent climate change. The goal is to investigate how the principles listed above are shaping current climate events.
Mechanisms
Temperature records
Figure
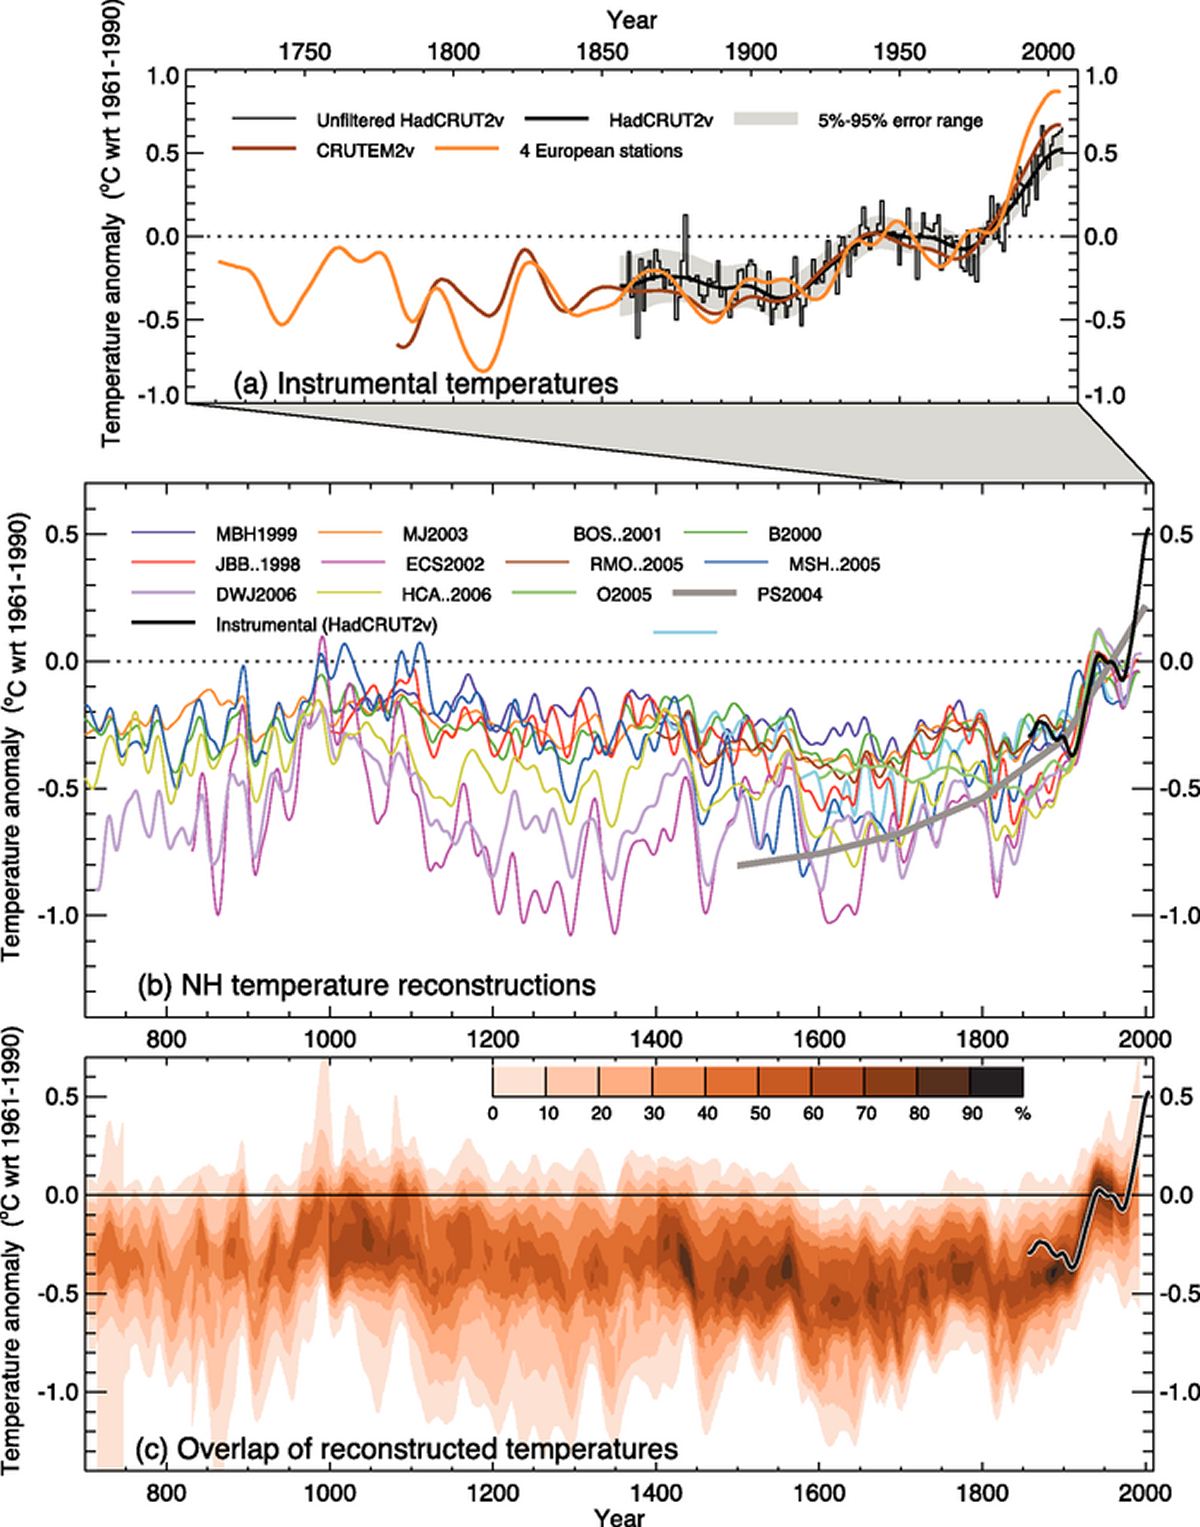
Northern Hemisphere Surface Air clearly shows that the current global average temperature reflects an interglacial warm period. If we focus in on the end of this record we can observe some of the fine scale changes in the global temperature records. Figure
Northern Hemisphere Surface Air combines proxy data (i.e., information from ice cores and tree rings) with the modern instrument record to create a graph showing the last 1300 years of Northern Hemisphere (hereafter, NH) temperatures. Each line on the top two panels represents a different temperature data set collected in the NH and the bottom panel color codes the percentage of overlap among these data sets.
Step 1: Find the mean. To find the mean, add up all the scores, then divide them by the number of scores. ...
Step 2: Find each score's deviation from the mean. ...
Step 3: Square each deviation from the mean. ...
Step 4: Find the sum of squares. ...
Step 5: Divide the sum of squares by n – 1 or N.
The sample of 16 students is taken. The average age in the sample was 22 years with astandard deviation of 6 years. Construct a 95% confidence interval for the age of the population.
Bhartdarshan' is an internet-based travel agency wherein customer can see videos of the cities they plant to visit. The number of hits daily is a normally distributed random variable with a mean of 10,000 and a standard deviation of 2,400
a. what is the probability of getting more than 12,000 hits?
b. what is the probability of getting fewer than 9,000 hits?
Bhartdarshan'is an internet-based travel agency wherein customer can see videos of the cities they plan to visit. The number of hits daily is a normally distributed random variable with a mean of 10,000 and a standard deviation of 2,400.
a. What is the probability of getting more than 12,000 hits
Receive real-time job alerts and never miss the right job again
Source:
OpenStax, Sustainability: a comprehensive foundation. OpenStax CNX. Nov 11, 2013 Download for free at http://legacy.cnx.org/content/col11325/1.43
Google Play and the Google Play logo are trademarks of Google Inc.
Notification Switch
Would you like to follow the 'Sustainability: a comprehensive foundation' conversation and receive update notifications?