<< Chapter < Page Chapter >> Page >

Arts and culture

Grade 7

Personal and social skills

Module 1

Using colour to create an artwork

visual arts

Activity 1:

To use colour to create an artwork as an individual or in a group

[lo 3.8]

Example of the colour wheel:

Revision of the colour wheel

Study the colour wheel above and answer the following questions:

  1. Name the three PRIMARY COLOURS on the colour wheel.
  2. Name the three SECONDARY COLOURS on the colour wheel.
  3. Name two WARM colours.
  4. Name two COOL/COLD colours.
  5. What do we call the colours that we get when we mix a primary colour with a secondary colour?
  6. Name two pairs of COMPLEMENTARY COLOURS on the colour wheel.
  7. Name two ANALOGOUS COLOURS.
  8. Explain how a yellow-green is mixed.
  • Discuss within your group what a landscape is and draw up a list of 10 objects found in a landscape.
  • Now draw a real or imaginary landscape on A3 size paper, using a pencil.
  • When you have completed this, draw the same landscape onto a second sheet of paper. You now have two similar landscapes . Swap your copied landscape with someone sitting next to you.
  • Paint the first landscape, using complementary colours and the second one using analogous colours .

Activity 2:

To use textures to create an artwork

[lo 3.8]

HOMEWORK ASSIGNMENT

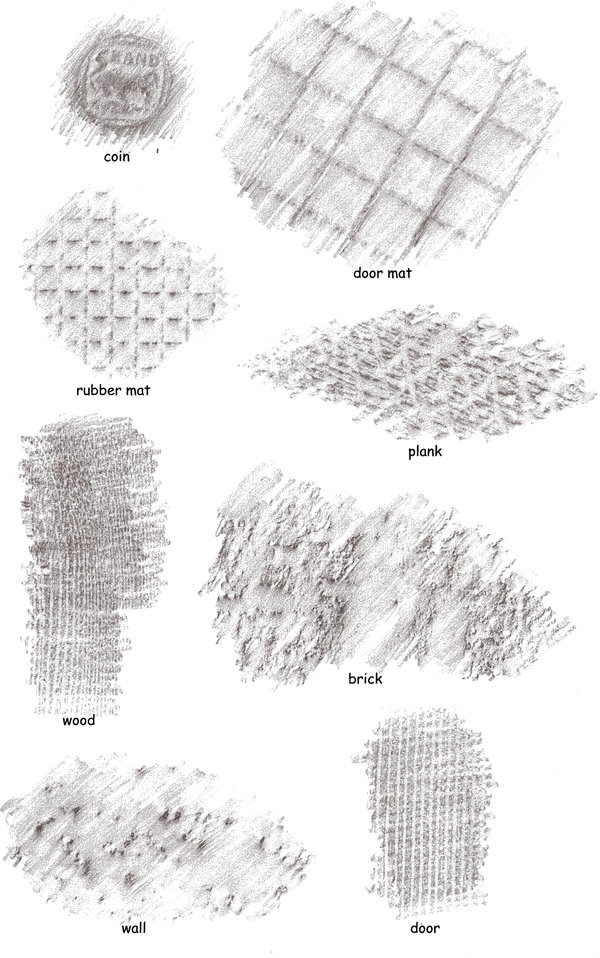
Bring a collection of 10 different textures to school by means of frottage . Frottage is a technique through which an image is attained by placing a sheet of paper over a textured object and using a soft pencil (2B, 4B or 6B) for rubbing across the surface of the paper. A familiar example is obtained by placing a coin under a piece of paper and rubbing over the paper with a pencil.

Think of getting textures from examples such as: shoe soles, brick walls, wooden floors, different materials, etc.

Divide your textures into the following:

OBJECT SMOOTH MEDIUM ROUGH

When you are working in the classroom, the group must divide a poster-sized sheet of paper into four equal parts. Then you must draw your frottage textures into these spaces. Each learner must have at least one chance to draw his or her textures into each space (quarter of the sheet of paper).

Colour can now be added, so that each quarter represents a season of the year. SUMMER can have lots of yellows, WINTER can have BLUES, SPRING can have GREENS or PURPLES and AUTUMN can have ORANGES, or a choice of any other colours. Each group must be allowed to decide which colours will be used to represent the different seasons.

Assessment

Learning Outcomes(LOs)
LO 3
PARTICIPATION AND COOPERATION The learner is able to display personal and social skills while participating in arts and culture activities as an individual and in a group
Assessment Standards(ASs)
We know this when the learner:
GENERAL In regard to 3.1 – 3.8 below:
  • is able to transform personal experiences into forms of expression;
  • is able to make his or her own contribution within the group;
VISUAL ARTS (3.8 )
  • discusses, plans and shares resources with others in producing a collective artwork or presentation to promote nation building in South Africa;

Questions & Answers

What are the factors that affect demand for a commodity
Florence Reply
differentiate between demand and supply giving examples
Lambiv Reply
differentiated between demand and supply using examples
Lambiv
what is labour ?
Lambiv
how will I do?
Venny Reply
how is the graph works?I don't fully understand
Rezat Reply
information
Eliyee
devaluation
Eliyee
t
WARKISA
hi guys good evening to all
Lambiv
multiple choice question
Aster Reply
appreciation
Eliyee
explain perfect market
Lindiwe Reply
In economics, a perfect market refers to a theoretical construct where all participants have perfect information, goods are homogenous, there are no barriers to entry or exit, and prices are determined solely by supply and demand. It's an idealized model used for analysis,
Ezea
What is ceteris paribus?
Shukri Reply
other things being equal
AI-Robot
When MP₁ becomes negative, TP start to decline. Extuples Suppose that the short-run production function of certain cut-flower firm is given by: Q=4KL-0.6K2 - 0.112 • Where is quantity of cut flower produced, I is labour input and K is fixed capital input (K-5). Determine the average product of lab
Kelo
Extuples Suppose that the short-run production function of certain cut-flower firm is given by: Q=4KL-0.6K2 - 0.112 • Where is quantity of cut flower produced, I is labour input and K is fixed capital input (K-5). Determine the average product of labour (APL) and marginal product of labour (MPL)
Kelo
yes,thank you
Shukri
Can I ask you other question?
Shukri
what is monopoly mean?
Habtamu Reply
What is different between quantity demand and demand?
Shukri Reply
Quantity demanded refers to the specific amount of a good or service that consumers are willing and able to purchase at a give price and within a specific time period. Demand, on the other hand, is a broader concept that encompasses the entire relationship between price and quantity demanded
Ezea
ok
Shukri
how do you save a country economic situation when it's falling apart
Lilia Reply
what is the difference between economic growth and development
Fiker Reply
Economic growth as an increase in the production and consumption of goods and services within an economy.but Economic development as a broader concept that encompasses not only economic growth but also social & human well being.
Shukri
production function means
Jabir
What do you think is more important to focus on when considering inequality ?
Abdisa Reply
any question about economics?
Awais Reply
sir...I just want to ask one question... Define the term contract curve? if you are free please help me to find this answer 🙏
Asui
it is a curve that we get after connecting the pareto optimal combinations of two consumers after their mutually beneficial trade offs
Awais
thank you so much 👍 sir
Asui
In economics, the contract curve refers to the set of points in an Edgeworth box diagram where both parties involved in a trade cannot be made better off without making one of them worse off. It represents the Pareto efficient allocations of goods between two individuals or entities, where neither p
Cornelius
In economics, the contract curve refers to the set of points in an Edgeworth box diagram where both parties involved in a trade cannot be made better off without making one of them worse off. It represents the Pareto efficient allocations of goods between two individuals or entities,
Cornelius
Suppose a consumer consuming two commodities X and Y has The following utility function u=X0.4 Y0.6. If the price of the X and Y are 2 and 3 respectively and income Constraint is birr 50. A,Calculate quantities of x and y which maximize utility. B,Calculate value of Lagrange multiplier. C,Calculate quantities of X and Y consumed with a given price. D,alculate optimum level of output .
Feyisa Reply
Answer
Feyisa
c
Jabir
the market for lemon has 10 potential consumers, each having an individual demand curve p=101-10Qi, where p is price in dollar's per cup and Qi is the number of cups demanded per week by the i th consumer.Find the market demand curve using algebra. Draw an individual demand curve and the market dema
Gsbwnw Reply
suppose the production function is given by ( L, K)=L¼K¾.assuming capital is fixed find APL and MPL. consider the following short run production function:Q=6L²-0.4L³ a) find the value of L that maximizes output b)find the value of L that maximizes marginal product
Abdureman
Got questions? Join the online conversation and get instant answers!
Jobilize.com Reply

Get Jobilize Job Search Mobile App in your pocket Now!

Get it on Google Play Download on the App Store Now


Source:  OpenStax, Arts and culture grade 7. OpenStax CNX. Sep 10, 2009 Download for free at http://cnx.org/content/col11027/1.1
Google Play and the Google Play logo are trademarks of Google Inc.

Notification Switch

Would you like to follow the 'Arts and culture grade 7' conversation and receive update notifications?

Ask