<< Chapter < Page Chapter >> Page >

Natuurwetenskappe

Graad 5

Lewe en lewenswyse

Module 3

Plante wat met sade voortplant

Aktiwiteit:

Om die lewensiklus van 'n plant wat sade voortplant te ondersoek

[lu 1.1, 1.2, 1.3, 2.3]

Voortplanting by plante wat met sade voortplant

Opdrag:

Versamel 'n paar tamatiesaadjies en bekyk hulle goed. Plak een van die sade op die onderstaande diagram. Die blaar, blom en plant is reeds vir jou geskets. Jy moet die vrug skets!

Versamel nou enige twee van die volgende sade:

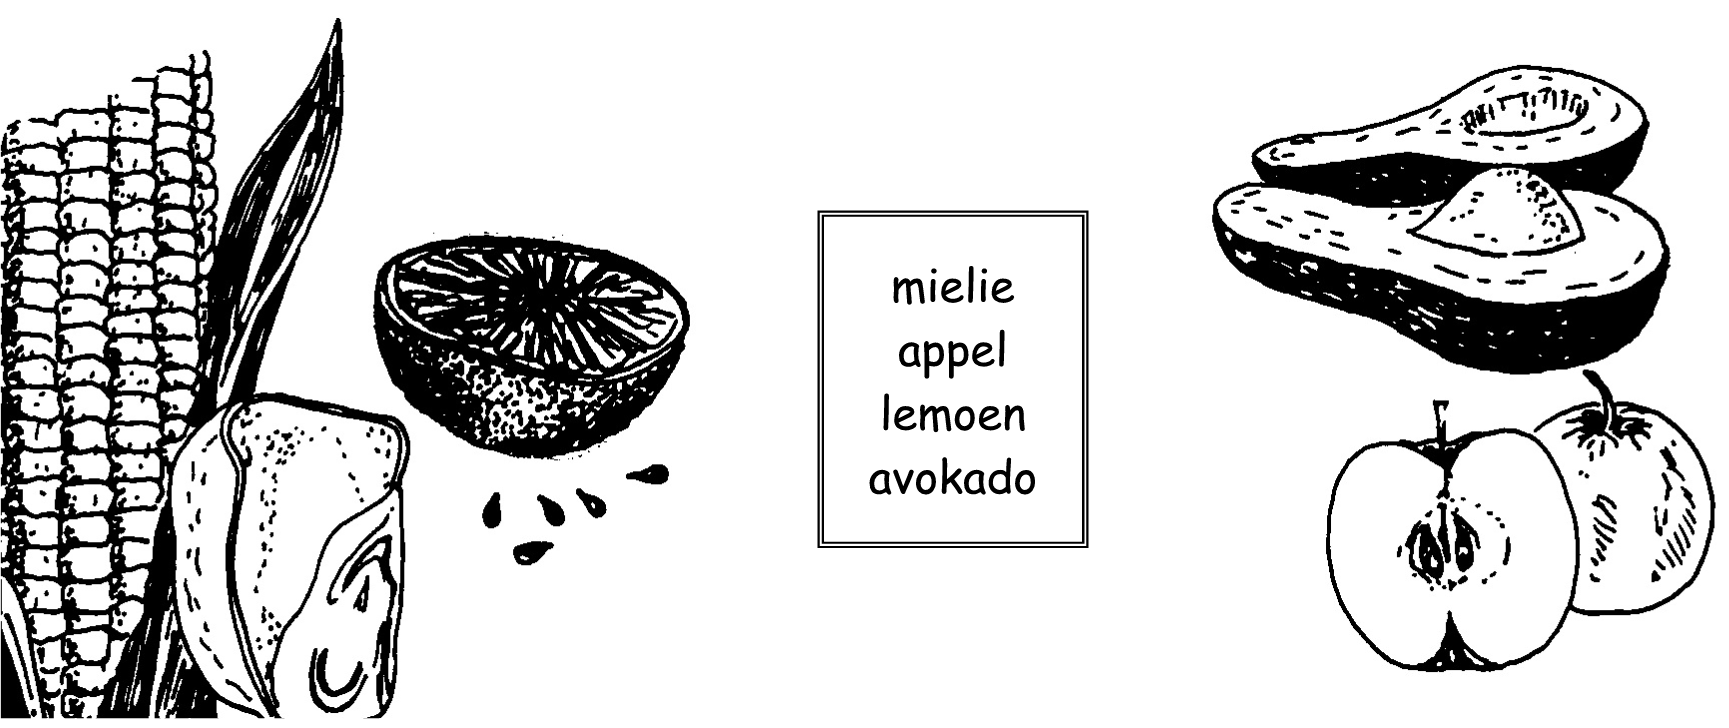
Doen nou dieselfde met die twee voorbeelde van jou keuse:

Bestuiwing en bevrugting

Blomme het vroulike sowel as manlike dele (op dieselfde blom). Die vroulike dele bestaan uit die stempel, styl en vrugbeginsel. Die meeldrade is die manlike dele.

'n Saad kan eers ontwikkel nadat die saadknop bevrug is. Stuifmeelkorrels (manlike geslagselle) beweeg van die meeldrade en val op die stempel (bestuiwing) vanwaar hulle in die styl af na die vrugbeginsel van die blom afgroei. Die stuifmeelbuis groei in die saadknop in en bevrugting vind plaas. Die saadknop kan nou tot ‘n saad ontwikkel.

Blomme word meesal bestuif deur ander blomme van dieselfde soort. Insekte soos bye, vlieë, motte en skoenlappers word deur die kleurvolle blomme nader gelok. Stuifmeel word dan deur die insekte van een blom na 'n ander oorgedra. Stuifmeelkorrels kleef aan die hare op hul bene en lywe vas.

Die wind laat ook bestuiwing by sekere plante plaasvind, soos konifere. Ander plante word weer met behulp van water bestuif.

Toets jou kennis:

  1. Skryf neer wat jy verstaan onder die volgende:

bestuiwing:

bevrugting:

  1. Wat is die verskil tussen ‘n saadknop en ‘n saad?

Assessering

LU 1

WETENSKAPLIKE ONDERSOEK Die leerder is in staat om met selfvertroue op weetgierigheid oor natuurlike verskynsels te reageer, en om binne die konteks van wetenskap, tegnologie en die omgewing verbande te ondersoek en probleme op te los.


Dit is duidelik wanneer die leerder:

1.1   ondersoeke beplan;

1.2   ondersoeke uitvoer en data versamel;

1.3       data evalueer en bevindinge kommunikeer;


LU 2

KONSTRUKSIE VAN WETENSKAPKENNIS Die leerder ken, interpreteer en pas wetenskaplike, tegnologiese en omgewingskennis toe.

Dit is duidelik wanneer die leerder:

2.1   betekenisvolle inligting onthou;

2.2   inligting kategoriseer;

2.3       inligting interpreteer.


Memorandum

Opdrag:

b)         water

c)         ontkiem

d)         ontkiem – lig

e)         sade het lug nodig om te ontkiem, en daar is min lug in die plastieksakkie.


f)         (i)      lug

(ii)     water

(iii)     warmte

g)         (i)      Hoekom verskyn die kiemwortel voor die blaartjie?

Om die plant wat besig is om te ontwikkel, in die grond te anker.

(ii)     In watter rigting groei die kiemwortel?

Af – om te anker – hoe dieper hoe stewiger en op soek na water/minerale ens.

i)        Sodat nuwe plante kan ontstaan.

Questions & Answers

differentiate between demand and supply giving examples
Lambiv Reply
differentiated between demand and supply using examples
Lambiv
what is labour ?
Lambiv
how will I do?
Venny Reply
how is the graph works?I don't fully understand
Rezat Reply
information
Eliyee
devaluation
Eliyee
t
WARKISA
hi guys good evening to all
Lambiv
multiple choice question
Aster Reply
appreciation
Eliyee
explain perfect market
Lindiwe Reply
In economics, a perfect market refers to a theoretical construct where all participants have perfect information, goods are homogenous, there are no barriers to entry or exit, and prices are determined solely by supply and demand. It's an idealized model used for analysis,
Ezea
What is ceteris paribus?
Shukri Reply
other things being equal
AI-Robot
When MP₁ becomes negative, TP start to decline. Extuples Suppose that the short-run production function of certain cut-flower firm is given by: Q=4KL-0.6K2 - 0.112 • Where is quantity of cut flower produced, I is labour input and K is fixed capital input (K-5). Determine the average product of lab
Kelo
Extuples Suppose that the short-run production function of certain cut-flower firm is given by: Q=4KL-0.6K2 - 0.112 • Where is quantity of cut flower produced, I is labour input and K is fixed capital input (K-5). Determine the average product of labour (APL) and marginal product of labour (MPL)
Kelo
yes,thank you
Shukri
Can I ask you other question?
Shukri
what is monopoly mean?
Habtamu Reply
What is different between quantity demand and demand?
Shukri Reply
Quantity demanded refers to the specific amount of a good or service that consumers are willing and able to purchase at a give price and within a specific time period. Demand, on the other hand, is a broader concept that encompasses the entire relationship between price and quantity demanded
Ezea
ok
Shukri
how do you save a country economic situation when it's falling apart
Lilia Reply
what is the difference between economic growth and development
Fiker Reply
Economic growth as an increase in the production and consumption of goods and services within an economy.but Economic development as a broader concept that encompasses not only economic growth but also social & human well being.
Shukri
production function means
Jabir
What do you think is more important to focus on when considering inequality ?
Abdisa Reply
any question about economics?
Awais Reply
sir...I just want to ask one question... Define the term contract curve? if you are free please help me to find this answer 🙏
Asui
it is a curve that we get after connecting the pareto optimal combinations of two consumers after their mutually beneficial trade offs
Awais
thank you so much 👍 sir
Asui
In economics, the contract curve refers to the set of points in an Edgeworth box diagram where both parties involved in a trade cannot be made better off without making one of them worse off. It represents the Pareto efficient allocations of goods between two individuals or entities, where neither p
Cornelius
In economics, the contract curve refers to the set of points in an Edgeworth box diagram where both parties involved in a trade cannot be made better off without making one of them worse off. It represents the Pareto efficient allocations of goods between two individuals or entities,
Cornelius
Suppose a consumer consuming two commodities X and Y has The following utility function u=X0.4 Y0.6. If the price of the X and Y are 2 and 3 respectively and income Constraint is birr 50. A,Calculate quantities of x and y which maximize utility. B,Calculate value of Lagrange multiplier. C,Calculate quantities of X and Y consumed with a given price. D,alculate optimum level of output .
Feyisa Reply
Answer
Feyisa
c
Jabir
the market for lemon has 10 potential consumers, each having an individual demand curve p=101-10Qi, where p is price in dollar's per cup and Qi is the number of cups demanded per week by the i th consumer.Find the market demand curve using algebra. Draw an individual demand curve and the market dema
Gsbwnw Reply
suppose the production function is given by ( L, K)=L¼K¾.assuming capital is fixed find APL and MPL. consider the following short run production function:Q=6L²-0.4L³ a) find the value of L that maximizes output b)find the value of L that maximizes marginal product
Abdureman
types of unemployment
Yomi Reply
What is the difference between perfect competition and monopolistic competition?
Mohammed
Got questions? Join the online conversation and get instant answers!
Jobilize.com Reply

Get Jobilize Job Search Mobile App in your pocket Now!

Get it on Google Play Download on the App Store Now


Source:  OpenStax, Natuurwetenskappe graad 5. OpenStax CNX. Sep 23, 2009 Download for free at http://cnx.org/content/col10980/1.2
Google Play and the Google Play logo are trademarks of Google Inc.

Notification Switch

Would you like to follow the 'Natuurwetenskappe graad 5' conversation and receive update notifications?

Ask