<< Chapter < Page Chapter >> Page >

Level curves

If hikers walk along rugged trails, they might use a topographical map that shows how steeply the trails change. A topographical map contains curved lines called contour lines . Each contour line corresponds to the points on the map that have equal elevation ( [link] ). A level curve of a function of two variables f ( x , y ) is completely analogous to a contour line on a topographical map.

This figure consists of two figures marked a and b. Figure a shows a topographic map of Devil’s Tower, which has its lines very close together to indicate the very steep terrain. Figure b shows a picture of Devil’s Tower, which has very steep sides.
(a) A topographical map of Devil’s Tower, Wyoming. Lines that are close together indicate very steep terrain. (b) A perspective photo of Devil’s Tower shows just how steep its sides are. Notice the top of the tower has the same shape as the center of the topographical map.

Definition

Given a function f ( x , y ) and a number c in the range of f , a level curve of a function of two variables    for the value c is defined to be the set of points satisfying the equation f ( x , y ) = c .

Returning to the function g ( x , y ) = 9 x 2 y 2 , we can determine the level curves of this function. The range of g is the closed interval [ 0 , 3 ] . First, we choose any number in this closed interval—say, c = 2 . The level curve corresponding to c = 2 is described by the equation

9 x 2 y 2 = 2 .

To simplify, square both sides of this equation:

9 x 2 y 2 = 4 .

Now, multiply both sides of the equation by −1 and add 9 to each side:

x 2 + y 2 = 5 .

This equation describes a circle centered at the origin with radius 5 . Using values of c between 0 and 3 yields other circles also centered at the origin. If c = 3 , then the circle has radius 0 , so it consists solely of the origin. [link] is a graph of the level curves of this function corresponding to c = 0 , 1 , 2 , and 3 . Note that in the previous derivation it may be possible that we introduced extra solutions by squaring both sides. This is not the case here because the range of the square root function is nonnegative.

Three concentric circles with center at the origin. The largest circle marked c = 0 has a radius of 3. The medium circle marked c = 1 has a radius slightly less than 3. The smallest circle marked c = 2 has a radius slightly more than 2.
Level curves of the function g ( x , y ) = 9 x 2 y 2 , using c = 0 , 1 , 2 , and 3 ( c = 3 corresponds to the origin).

A graph of the various level curves of a function is called a contour map    .
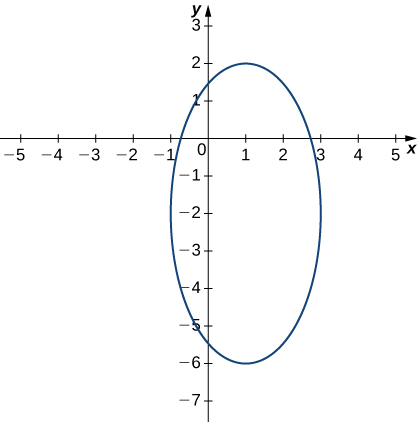
Making a contour map

Given the function f ( x , y ) = 8 + 8 x 4 y 4 x 2 y 2 , find the level curve corresponding to c = 0 . Then create a contour map for this function. What are the domain and range of f ?

To find the level curve for c = 0 , we set f ( x , y ) = 0 and solve. This gives

0 = 8 + 8 x 4 y 4 x 2 y 2 .

We then square both sides and multiply both sides of the equation by −1 :

4 x 2 + y 2 8 x + 4 y 8 = 0 .

Now, we rearrange the terms, putting the x terms together and the y terms together, and add 8 to each side:

4 x 2 8 x + y 2 + 4 y = 8 .

Next, we group the pairs of terms containing the same variable in parentheses, and factor 4 from the first pair:

4 ( x 2 2 x ) + ( y 2 + 4 y ) = 8 .

Then we complete the square in each pair of parentheses and add the correct value to the right-hand side:

4 ( x 2 2 x + 1 ) + ( y 2 + 4 y + 4 ) = 8 + 4 ( 1 ) + 4 .

Next, we factor the left-hand side and simplify the right-hand side:

4 ( x 1 ) 2 + ( y + 2 ) 2 = 16 .

Last, we divide both sides by 16 :

( x 1 ) 2 4 + ( y + 2 ) 2 16 = 1 .

This equation describes an ellipse centered at ( 1 , −2 ) . The graph of this ellipse appears in the following graph.

An ellipse with center (1, –2), major axis vertical and of length 8, and minor axis horizontal of length 4.
Level curve of the function f ( x , y ) = 8 + 8 x 4 y 4 x 2 y 2 corresponding to c = 0 .

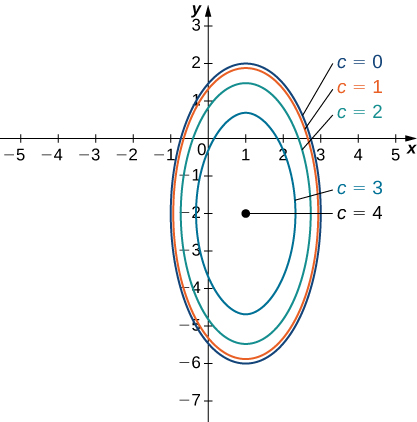
We can repeat the same derivation for values of c less than 4 . Then, [link] becomes

4 ( x 1 ) 2 16 c 2 + ( y + 2 ) 2 16 c 2 = 1

for an arbitrary value of c . [link] shows a contour map for f ( x , y ) using the values c = 0 , 1 , 2 , and 3 . When c = 4 , the level curve is the point ( −1 , 2 ) .

An series of four concentric ellipses with center (1, –2). The largest one is marked c = 0 and has major axis vertical and of length 8 and minor axis horizontal of length 4. The next smallest one is marked c = 1 and is only slightly smaller. The next two are marked c = 2 and c = 3 and are increasingly smaller. Finally, there is a point marked c = 4 at the center (1, –2).
Contour map for the function f ( x , y ) = 8 + 8 x 4 y 4 x 2 y 2 using the values c = 0 , 1 , 2 , 3 , and 4 .
Got questions? Get instant answers now!

Questions & Answers

what is phylogeny
Odigie Reply
evolutionary history and relationship of an organism or group of organisms
AI-Robot
ok
Deng
what is biology
Hajah Reply
the study of living organisms and their interactions with one another and their environments
AI-Robot
what is biology
Victoria Reply
HOW CAN MAN ORGAN FUNCTION
Alfred Reply
the diagram of the digestive system
Assiatu Reply
allimentary cannel
Ogenrwot
How does twins formed
William Reply
They formed in two ways first when one sperm and one egg are splited by mitosis or two sperm and two eggs join together
Oluwatobi
what is genetics
Josephine Reply
Genetics is the study of heredity
Misack
how does twins formed?
Misack
What is manual
Hassan Reply
discuss biological phenomenon and provide pieces of evidence to show that it was responsible for the formation of eukaryotic organelles
Joseph Reply
what is biology
Yousuf Reply
the study of living organisms and their interactions with one another and their environment.
Wine
discuss the biological phenomenon and provide pieces of evidence to show that it was responsible for the formation of eukaryotic organelles in an essay form
Joseph Reply
what is the blood cells
Shaker Reply
list any five characteristics of the blood cells
Shaker
lack electricity and its more savely than electronic microscope because its naturally by using of light
Abdullahi Reply
advantage of electronic microscope is easily and clearly while disadvantage is dangerous because its electronic. advantage of light microscope is savely and naturally by sun while disadvantage is not easily,means its not sharp and not clear
Abdullahi
cell theory state that every organisms composed of one or more cell,cell is the basic unit of life
Abdullahi
is like gone fail us
DENG
cells is the basic structure and functions of all living things
Ramadan
What is classification
ISCONT Reply
is organisms that are similar into groups called tara
Yamosa
in what situation (s) would be the use of a scanning electron microscope be ideal and why?
Kenna Reply
A scanning electron microscope (SEM) is ideal for situations requiring high-resolution imaging of surfaces. It is commonly used in materials science, biology, and geology to examine the topography and composition of samples at a nanoscale level. SEM is particularly useful for studying fine details,
Hilary
Got questions? Join the online conversation and get instant answers!
Jobilize.com Reply
Practice Key Terms 7

Get Jobilize Job Search Mobile App in your pocket Now!

Get it on Google Play Download on the App Store Now


Source:  OpenStax, Calculus volume 3. OpenStax CNX. Feb 05, 2016 Download for free at http://legacy.cnx.org/content/col11966/1.2
Google Play and the Google Play logo are trademarks of Google Inc.

Notification Switch

Would you like to follow the 'Calculus volume 3' conversation and receive update notifications?

Ask